1. Introduction:
The purpose of a sound system is to transmit information. In the case of public address, paging, voice alarm and speech reinforcement systems the object is to transmit intelligible speech to listeners and intended message recipients. This aspect is far more important than sound quality per se, since there is no point in designing a system if it cannot be understood or is incapable of ‘getting the message across.’ Although sound quality and speech intelligibility are inextricably linked, they are not the same. It is possible to have a poor sounding system that is highly intelligible (e. g., a frequency limited re-entrant horn with uneven response) and a high quality loudspeaker that is virtually unintelligible (an expensive hi-fi system in the center of an aircraft hangar).
Many factors important to speech intelligibility are well understood and can be used to help develop guidelines for successful system design. The importance of high system intelligibility is ever increasing, not only as the public’s expectation of sound quality continues to grow, but also as the need to make intelligible emergency announcements at public facilities and sports venues takes on greater importance.
The information presented in this broad overview of sound reinforcement has been assembled from many sources. Through an understanding of these essential principles, users will be better able to design, install and troubleshoot sound systems for speech.
2. Clarity and Audibility:
A common mistake often made when discussing intelligibility is to confuse audibility with clarity. Just because a sound is audible does not mean it will be intelligible. Audibility relates to hearing sound, either from a physiological point of view or in terms of signal-to noise ratio. Clarity describes the ability to detect the structure of a sound and, in the case of speech, to hear consonants and vowels and to identify words correctly.
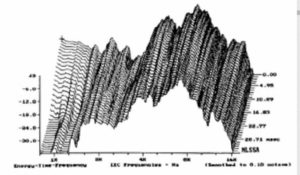
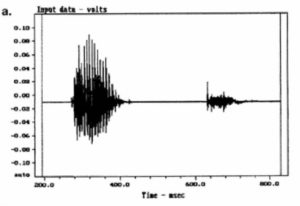
A speech signal involves the dimensions of sound pressure, time and frequency. Figure 1 shows a typical speech waveform for the syllables “J, B and L.” Each syllable has a duration of about 300 – 400 ms, and complete words are about 600 – 900 ms in length, dependent on their complexity and the rate of speech. A spectrographic analysis of the phrase “JBL” is shown in Figure 2. In this display the left (y) axis shows frequency, the bottom (x) axis shows time, and the intensity of the display shows amplitude. The lower horizontal bars in the display represent the fundamental voice frequencies at approximately 150, 300, 450 and 600 Hz for the letters “J” and “B”. For the letter “L” the fundamentals are at approximately 190, 370 and 730 Hz.
Figure 1. A typical speech waveform J-B-L.
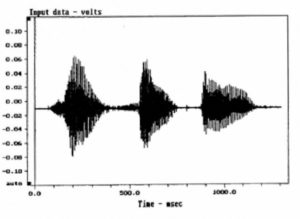
Figure 2. Time/frequency spectrograph of “JBL”.
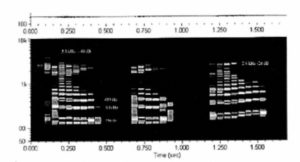
Figure 3 shows a spectrum analysis of the vowel sound “a” and consonant sound V. The vowel is made up of a series of resonances produced by the vocal cord-larynx system. The “s” sound has a different spectrum and is continuous over a wide, high frequency range extending beyond 12 kHz.
Figure 3. Spectral response of typical vowel (a) and consonant (s) sounds.
Voiced Speech Sound: Vowel “a”
Unvoiced Speech Sound: Consonant V
3. Factors Determining or Affecting Sound System Intelligibility:
Primary factors are:
* Sound system bandwidth and frequency response
* Loudness and signal-to-noise ratio (S/N)
* Room reverberation time
* Room volume, size and shape of the space
* Distance from listener to loudspeaker
* Directivity of the loudspeaker
* Number of loudspeakers in operation
* Direct to reverberant ratio (directly dependent upon the last five factors)
• Talker annunciation/rate of delivery
• Listener acuity
Secondary factors include:
• Gender of talker
* System distortion
* System equalization
* Uniformity of coverage
* Sound focusing and presence of any discrete reflections
* Direction of sound arriving at listener
* Direction of interfering noise
• Vocabulary and context of speech information
• Talker microphone technique
The parameters marked * are building or system related, while those marked • relate to human factors outside the control of the physical system. It should be noted however that two of the primary factors (talker annunciation/rate of delivery and listener acuity) are outside the control of both the system and building designer. Each of the above factors will now be discussed.
4. Frequency Response and Bandwidth:
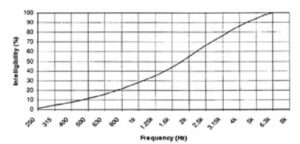
Speech covers the frequency range from approximately 100 Hz to 8 kHz, although there are higher harmonics affecting overall sound quality and timbre extending to 12 kHz, as seen in Figure 3. Figure 4 shows an averaged speech spectrum and the relative frequency contributions in octave band levels. Maximum speech power is in the 250 and 500 Hz bands, falling off fairly rapidly at higher frequencies. Lower frequencies correspond to vowel sounds and the weaker upper frequencies to consonants. The contributions to intelligibility do not follow the same pattern. In Figure 5 we can clearly see that upper frequencies contribute most to intelligibility, with the octave band centered on 2 kHz contributing approximately 30%, and the 4 and 1 kHz bands 25% and 20% respectively. Figure 6 shows this in a different manner. Here the cumulative effect of increasing system bandwidth is shown, and 100% intelligibility is achieved at just over 6 kHz bandwidth. This graph is useful in that it allows the effect of limiting bandwidth to be evaluated. For example, restricting the higher frequencies to around 3.5 kHz will result in a loss of about 20% of the potential intelligibility.
Figure 4. Long-term speech spectrum.
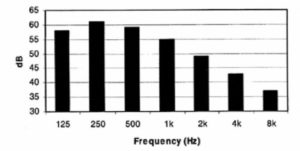
Figure 5. Octave-band contributions to speech intelligibility.
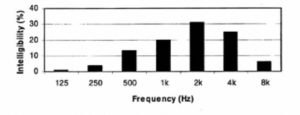
Figure 6. Cumulative effect of high frequency bandwidth on intelligibility.
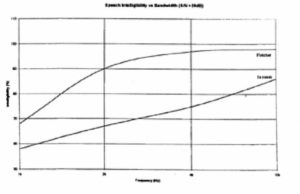
Data with respect to bandwidth and intelligibility may vary according to underlying experimental methods. For example, Figure 7 contrasts well known early data relating to telephone (monophonic) measurements that do not include any room effects with a recent experiment carried out in a reverberant space with T60= 1.5 s. The upper curve (Fletcher, 1929) shows that the contribution to intelligibility flattens out above 4 kHz, with little further improvement above that frequency. The lower curve, made with a sound system in a real space, shows that intelligibility improvements continue up to 10 kHz. The importance of achieving extended high frequency response is immediately seen and points up the need to ensure an adequate S/N ratio in the important intelligibility bands of 2 and 4 kHz.
Figure 7. Effect of bandwidth on intelligibility.
Limited bandwidth these days should generally not be a problem, since most modern sound equipment can cover the spectrum important to speech intelligibility. There are however some exceptions:
* Inexpensive, poor quality microphones
* Some re-entrant horn loudspeakers
* Some inexpensive digital message storage systems
* Miniature special purpose loudspeakers
By far the most common problems in frequency response are caused by loudspeaker and boundary/room interactions and interactions between multiple loudspeakers. Figure 8 shows the effect of wall mounting a nominally flat response loudspeaker system, significantly affecting its perceived sound quality and clarity. These conditions will be discussed in later sections dealing with system equalization and optimization.
Figure 8. Loudspeaker/boundary interaction.
Against wall
2 m from wall
5. Loudness and Signal to Noise Ratio:
The sound pressure level produced by a sound system must be adequate for listeners to be able to hear it comfortably. If the level is too low, many people, particularly the elderly or those suffering even mild hearing loss, may miss certain words or strain to listen, even under quiet conditions. The levels preferred by listeners may be surprising; although informal face to face communication often takes place about 65 dB-A, levels of 70 – 75 dB-A are often demanded at conferences and similar meetings – even under quiet ambient conditions.
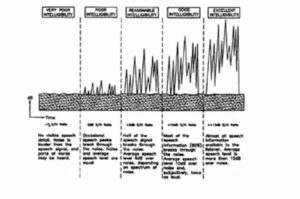
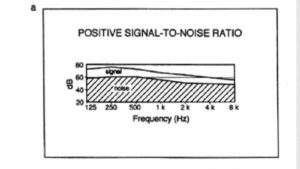
In noisy situations it is essential that a good S/N ratio be achieved. As shown in Figure 9, at a negative S/N ratio the noise is louder than the signal, completely masking it and resulting in virtually zero intelligibility. At a zero dB nominal S/N ratio, occasional speech peaks will exceed the noise and some intelligibility will result. As the S/N ratio increases so does the intelligibility. Over the years various ‘rules of thumb’ have been developed regarding required S/N ratios. As a minimum, 6 dB-A is required, and at least 10 dB-A should be aimed for. Above 15 dB-A there is some improvement still to be had, but the law of diminishing returns sets in.
Figure 9. Effect of S/N ratios on speech intelligibility.
There is also some contradiction within the body of accepted reference data. Figure 10 shows the general relationship between S/N ratio and intelligibility. As we can see, this is effectively a linear relationship. In practice however the improvement curve flattens out at high S/N ratios – though this is highly dependent on test conditions. This is shown in Figure 11, which compares results of a number of intelligibility studies using different test signals. We can see that, for more difficult listening tasks, the greater the S/N ratio has to be in order to achieve good intelligibility. Figure 12 shows the Alcons percentage loss of consonants scale, which will be discussed in later sections. Here again we see a linear relationship leveling off at 25 dB S/N.
Figure 10. S/N ratio and intelligibility.
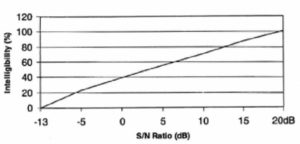
Figure 11. Articulation Index versus intelligibility word scores.
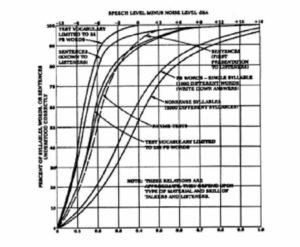
Figure 12. Effect to Signal to Noise ration on %Alcons intelligibility scale.
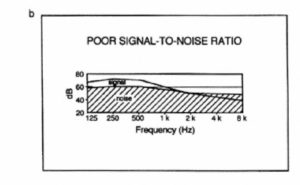
Under high noise conditions, such S/N ratios would normally require excessive signal levels. At high sound levels, the intelligibility of speech actually decreases, achieving a maximum value at about 80dB, as shown in Figure 13. Where noise is a problem, a full spectrum analysis should be carried out, as shown in Figure 14. Such analysis will determine just where the problems lie and where most benefit can be obtained. Recall the frequency contributions to intelligibility shown in Figure 5; from this information the Articulation Index (AI) can be calculated.
Figure 13. Effect of sound pressure level on speech intelligibility.
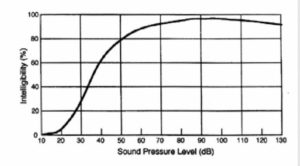
Figure 14. Comparison of speech and noise levels. Good S/N (a); poor S/N (b).
In many situations the background noise may vary over time. This is particularly true in industrial situations, transportation terminals and particularly in sports and other spectator venues where crowd noise is highly dependent upon the activity. Figure 15 shows the time dependence of noise level in an underground train station. As the train approaches the platform, the noise level increases, reaching a maximum as the engine passes by. The doors then open and the people exit, with the noise level dropping appreciably. Announcements in competition with the 90 to 100 dB-A levels of the train arrival are difficult to understand- A better plan would be either to make announcements just before the train arrives or to wait until the doors are open.
Figure 15. Subway noise versus time. Linear (upper-curve). A-weighted (lower curve).
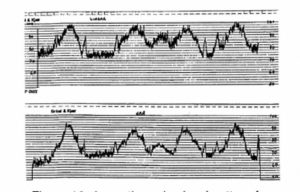
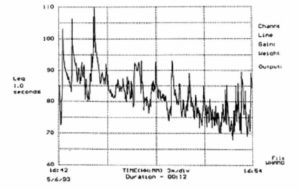
Figure 16 shows the noise level pattern for a football game in a large stadium. The level varies rapidly, depending on field action, and during goal attempts and touchdowns the noise level is maximum.
Figure 16. Football game noise analysis over a 12 second period.
An aspect of S/N ratio often forgotten is the noise environment at the microphone itself. In many cases paging microphones are located in noisy areas, and the speech S/N ratio is further degraded by noise passing through the system. Directional microphones can often provide useful attenuation of interfering sounds – but this potential gain may be lost in reverberant spaces or by local reflections from the desk, ceiling or other surroundings. When the microphone has to be located in a particularly noisy environment, a good quality noise canceling microphone should be used. There may also be the opportunity of providing a local noise refuge in the form of an acoustic hood or enclosure to produce a quieter local zone at the microphone. At least 20 dB-A, preferably >25 dB-A S/N should be targeted for the microphone zone.
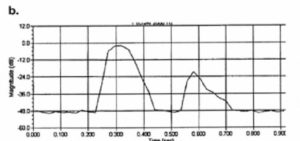
6. Reverberation Time, Early Reflections and Direct to Reverberant Ratio:
Just as noise can mask speech levels, so too can excessive reverberation. However, unlike the simpler the S/N ratio, the way in which the D/R ratio affects speech intelligibility is not constant but depends on the room reverberation time and reverberant field level. Figure 17 shows a simplified temporal envelope of the word back. The word starts suddenly with the relatively loud ba sound. This is followed some 300 ms later by the lower level consonant ck sound. Typically the ck sound will be 20 – 25 dB lower than the ba sound. With a short reverberation time of 0.6s, which would be typical of many well-furnished domestic rooms, the ba sound has time to die away before the onset of the ck sound. Assuming a 300 ms gap, the ba will have decayed around 30 dB and will not mask the later ck.
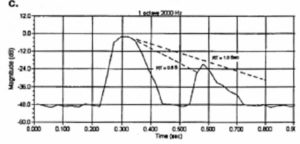
However, if the reverberation time increases to 1 second and if the reverberant level in the room is sufficiently high, the ba sound will only have decayed by 18 dB and will completely mask the ck sound by some 8 to 13 dB. It will therefore not be possible to understand the word back or distinguish it from similar words such as bat, bad, ban, bath or bass, since the important consonant region will be lost. However, when used in the context of a sentence or phrase, it well may be deciphered by the listener or worked out from the context. Further increase of T60 to 1.5 s will produce 12 -13 dB of masking. Not all reverberation should be considered a bad thing since some degree of reverberation is essential to aid speech transmission and to provide a subjectively acceptable acoustic atmosphere, No one would want to live in an anechoic chamber.
Figure 17. Reverberant masking. Waveform of word “back” (a); amplitude envelope (b); envelope with reverberant decay (c).
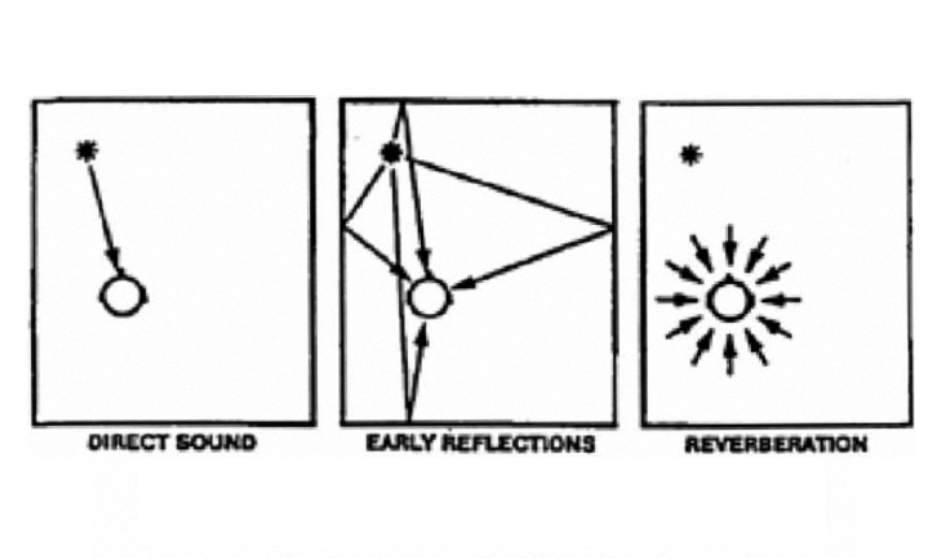
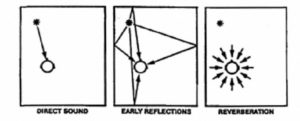
The sound field in a large space is complex. Statistically it may be broken into two components: the direct and the reverberant sound fields. However, from the point of view of speech intelligibility, we can identify four components:
* Direct sound – directly from the source to the listener,
* Early reflections – arriving at the listener approximately 35 – 50 ms later,
* Late reflections – arriving at the listener approximately 50 – 100 ms later, and
* Reverberation – arriving at the listener later than 100 ms.
Figure 18 shows a simplified representation of this. Direct sound and early reflections integrate, and under noisy conditions these early reflections aid intelligibility by increasing the resultant S/N ratio. Late reflections generally do not integrate with the direct sound and generally degrade intelligibility.
Figure 18. Sound field diagram: direct, early and late reflections.
Sound arriving after approximately 100 ms generally signals the start of the reverberant field, although discrete, strong reflections arriving after 50 – 60 ms will be perceived as echoes. It is the ratio of direct-plus-early reflections to late-reflections-plus-reverberation that determines the potential intelligibility in a reverberant space, assuming that there is no degradation from background noise. As a rule, positive ratios are desirable though not necessarily essential for intelligibility.
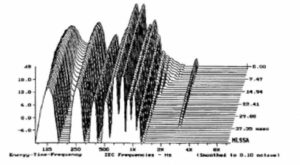
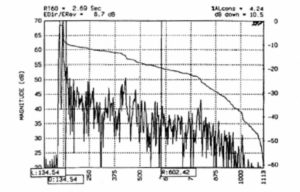
Figure 19 shows an energy time curve (ETC) sound arrival analysis for a highly directional (high Q) loudspeaker in a large reverberant church (T60 = 2.7 seconds). The D/R ratio at the measuring position is 8.7 dB, resulting in a high degree of intelligibility. Other intelligibility ratings given by this program are: Alcons 4.2%, RASTI 0.68, and CM 9.9 dB. (These intelligibility indices will be discussed later in Section 11.)
Figure 19. ETC showing high D/R ratio.
Exchanging the high Q device for a low Q, virtually omnidirectional loudspeaker produced the ETC analysis shown in Figure 20. A very different reflection pattern/sound arrival sequence occurs causing greater excitation of the late and reverberant sound fields. Now the D/R ratio is -4 dB, resulting in 13% AUS. The C50 has been reduced to -3.6 dB and the equivalent RASTI to 0.48.
Figure 20. ETC showing low D/R ratio.
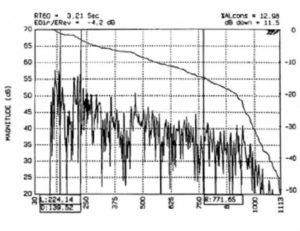
Figure 21 shows an ETC for a high-density distributed system. At first glance this resembles the ETC for a low-Q device, and might suggest low intelligibility since no clear direct sound component is visible. However, densely distributed ceiling loudspeakers do not work as point source systems do. Here, the object is to provide a dense, short path length section sound arrival sequence from multiple nearby sources. The early reflection density will be high, and in well controlled rooms the later arriving reflections and reverberant field will be attenuated, resulting in high intelligibility and smooth coverage. In the case shown in Figure 21 the TM was 1.2 s; CM was 2.6 dB and RASTI was 0.63, both assuring high intelligibility.
Figure 21. ETC for ceiling distributed system.
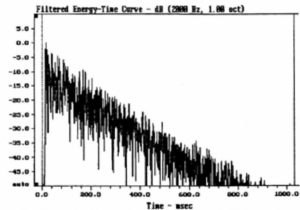
Distributed ceiling system -10 x 15 x 4m RT on Axis 1.2s RT on Axis
6.1 Peutz’ Articulation Loss of Consonants (ALcons):
While it is possible to accurately calculate the direct and reverberant components from conventional statistical acoustics, it is not possible to accurately estimate, on a statistical basis, the early and late reflection fields. To do this requires a computer model of the space and a complex ray tracing/reflection analysis program. However, some statistically based calculation methods based on direct and reverberant fields have been devised which give a reasonable degree of accuracy, particularly for single point or central cluster based loudspeaker arrays. The calculation is fairly complex and depends upon the following factors:
* Loudspeaker directivity
* Quantity of loudspeakers operating
* Reverberation time
* Distance between listener and loudspeaker
* Volume of the space
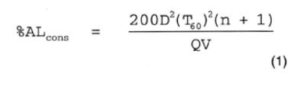
These factors are all found in the following simple %ALcons equation developed from the work of Peutz (1971), who related speech intelligibility to a ‘loss of information’ and found that intelligibility was related to the critical distance within a space. (Critical distance is the distance from a loudspeaker to a position in the room at which direct and reverberant fields are equal; the equivalent D/R at critical distance is zero dB), Peutz found that within critical distance good intelligibility was normally found; beyond critical distance the intelligibility decreased until a limiting distance of approximately 3 times critical distance was reached (D/R = -10 dB). The basic Peutz equation, modified by Klein (1972) is:
From equation 1 it can be seen that the intelligibility in a reverberant space is proportional to the volume (V) of the space and the directivity (Q) of the loudspeaker (i.e., increasing either of these parameters while maintaining the others constant will improve the intelligibility). Intelligibility is inversely proportional to the squares of T60 and distance (D) between the listener and the loudspeaker.
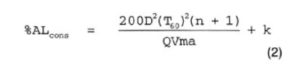
The equation was subsequently modified to take account of talker articulation and the effect that an absorbing surface has on the area covered by the loudspeakers:
In this equation, m is a critical distance modifier that takes into account the higher than normal absorption of the floor with an audience present; for example, m = (1 – a)/(1 – ac), where a is the average absorption coefficient and ac is the absorption in the area covered by the loudspeaker, k is a listener/talker correction constant, typically in the range of 1 3%; however, poor listeners and talkers can increase this value as high as 12.5%.
From equation 1 it can be seen that the intelligibility in a reverberant space is proportional to the volume (V) of the space and the directivity (Q) of the loudspeaker (i.e., increasing either of these parameters while maintaining the others constant will improve the intelligibility). Intelligibility is inversely proportional to the squares of T60 and distance (D) between the listener and the loudspeaker.
The equation was subsequently modified to take account of talker articulation and the effect that an absorbing surface has on the area covered by the loudspeakers:
In this equation, m is a critical distance modifier that takes into account the higher than normal absorption of the floor with an audience present; for example, m = (1 – a)/(1 – ac), where a is the average absorption coefficient and ac is the absorption in the area covered by the loudspeaker, k is a listener/talker correction constant, typically in the range of 1 3%; however, poor listeners and talkers can increase this value as high as 12.5%.
Peutz found that the limit for successful communication was around 15% ALcons. From 10 to 5% intelligibility is generally rated as good, and below 5% the intelligibility can be regarded as excellent, as shown in Figure 22. A limiting condition %Alcons = (9T60 + k) was also found to occur by Peutz.
Figure 22. Articulation loss of consonants (ALcons).
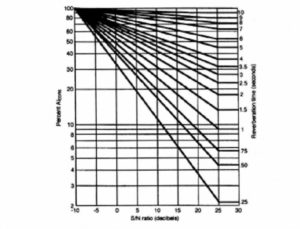
Although not immediately obvious, the equation is effectively giving the D/R ratio. By rearranging the equation, the effect of the D/R ratio on %ALcons can be plotted with respect to reverberation time, as shown in Figure 23. From the figure, the potential intelligibility can be directly read from the graph as a function of D/R and reverberation time. By reference to Figure 12 the effect of background noise S/N ratio may also be incorporated. Peutz’ equations assume that the octave band centered at 2 kHz is the most important in determining intelligibility, and the estimation program assumes that values of direct level, reverberant level, reverberation time and noise level are all to be measured in that octave band. Also, there is the assumption that there are no abnormal echoes in the space and that room is well behaved statistically as regards to both reverberation time and noise spectrum.
Figure 23. %ALcons versus D/R ratio.
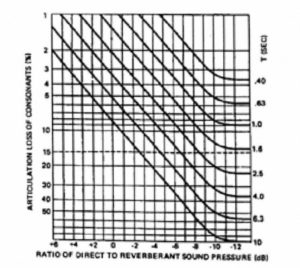
Portable articulation loss of consonants vs. reverberation time and direct-to-reverberant sound ratio
6.2 New Equations and More Accurate Results:
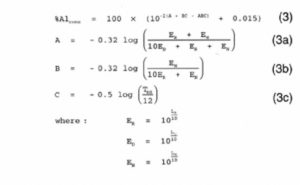
As given, equations 1 and 2 are not very useful in this day and age of computer system analysis, and they are presented here for their tutorial value only. In the mid 1980s Peutz redefined the %Alcons equations and presented them in terms of direct and reverberant levels (LD and Lr), background noise level (LN) and reverberation time 7. In this form, the equations are now compatible with many systems design programs, such as CADP2 and EASE, in which displays of direct field coverage and direct-to-reverberant ratio can be seen screenwide for the entire room.
Let us now make a comparison of Peutz’ original charts and the new equations; Let us assume that in a given room the computer simulations give the following values: T60 = 4 seconds, LH = 70 dB and LD = 65 dB, or a D/R ratio of -5 dB. Let us further assume that the space will have a noise floor of 25 dB-A, about 40 dB below the direct sound level.
First, we go to Figure 23 where we can read, virtually by inspection, a value of about 11% ALcons. Since the noise floor is greater than 25 dB below the speech level we can ignore the contribution of noise completely, and the solution is a simple one.
Moving on to equation set 3, we calculate the values of ER3, ED and EN as: ER= 10(7), ED =3 x 10(6) and EN = 3×10 (2)
We then calculate the values of A, B and C as:
A= 0.036
B= 1.76
C = 0.24
Entering these values into equation 3 gives %ALcons = 14%.
This value is only slightly higher than the 11% value taken from Figure 23, and represents a more accurate estimate of what might actually be expected. The difference between old and new appears nearly within the ±10% accuracy Peutz stated for the estimation program. Many sound system design and analysis programs now routinely include a calculation of ALcons, based on this equation set.
6.3 Summary of Reverberation Effects on Intelligibility:
Table 1 shows the general effect of reverberation time on a variety of sound reinforcement parameters. These are to be taken as general guidelines in the selection of system type.
Table 1. Influence of Reverberation Time on System Design and Performance
T60: Characteristics:
<1 second: Excellent intelligibility can be achieved
1,0 – 1.2 seconds: Excellent to good intelligibility sound can be achieved.
1.2-1.5 seconds: Good intelligibility can be achieved, though loudspeaker type and location become important.
>1.5 seconds: Careful design required (loudspeaker selection and spacing).
1.7 seconds: Limit for good intelligibility in large spaces with distributed systems (e. g., shopping malls and airline terminals).
>1.7 seconds: Directional loudspeakers required (churches, multipurpose auditoriums and highly reflective spaces).
>2 seconds: Very careful design required. High quality directional loudspeakers required. Intelligibility may have limitations (concert
halls, churches, treated sports halls/arenas).
>2.5 seconds: Intelligibility will have limitations. Highly directional loudspeakers required, (large masonry churches, sports facilities,
arenas, atriums, enclosed railway stations and transportation terminals).
>4 seconds: Very large churches, cathedrals, mosques, large and untreated atriums, aircraft hangars, untreated enclosed ice sports
arenas/stadiums. Highly directional speakers required and located as close to the listener as possible.
When designing or setting up systems for highly reverberant and reflective environments, the main rule to follow is: aim the loudspeakers at the listeners and keep as much sound as possible off the walls and ceiling. This tends to maximize the D/R ratio, though in practice it may not be quite so simple.
7. Echoes and Late Reflections:
As mentioned earlier, speech signals arriving within approximately 35 ms of the direct sound generally integrate with the direct sound and aid intelligibility. In most sound system applications, and particularly in distributed systems, considerable numbers of early reflections will be received at a given listening position, and some bridging (sequential masking) may occur which can extend the useful arrival time out to perhaps 50 ms. The way in which single or discrete reflections affect intelligibility and our perception has been studied by a number of researchers. The best known is probably Haas.
Haas found that under certain conditions, delayed sounds (reflections) arriving after an initial direct sound could in fact be louder than the direct sound without affecting the apparent localization of the source. This is often termed the Haas effect, Haas also found that later arriving sounds may or may not be perceived as echoes, depending upon their delay time and level. These findings are of significant importance to sound system design and enable delayed in-fill loudspeakers to be used to aid intelligibility in many applications ranging from under or over-balcony fills in auditoriums and pew back systems in churches to large venue rear fill loudspeakers. If the acoustic conditions allow, improved intelligibility and sound clarity can be achieved without loss of localization.
Figure 24 presents the basic Haas curve. Haas showed that with delays of about 15 to 25 milliseconds a secondary signal had to be about +10 dB higher in level than the primary for it to be judged as being as equally loud. This is quite an astonishing result and further helps to explain the integration characteristics of the ear. The curve should not be confused with the true precedence effect, which was studied by Wallach and Meyer Shodder. This describes an effect in which listeners lock onto the direction of the first arriving sound and ignore, either partially or completely, subsequent short term delayed sounds or reflections. In this effect the delayed sounds integrate or fuse completely with the initial or direct sound, as shown in Figure 25.
We therefore have two useful phenomena which can be used to advantage in sound system design:
* Listeners tend to lock onto the first arrival sound and its direction, ignoring short-term delayed secondary sounds.
* Secondary sounds arriving within approximately 30 – 35 ms of the initial or primary sound fuse with it to produce one apparent sound of increased loudness. Furthermore, the secondary sounds may be up to 10 dB louder than the primary before being judged as equally loud.
Figure 24. Basic Haas effect curve.
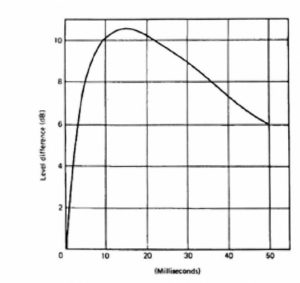
Figure 25. Haas echo disturbance curves.
Unfortunately, a widely held and often quoted misconception has arisen as a result of the above findings. It implies that a secondary or delayed signal can be up to 10 dB louder than the primary or direct sound before it is perceived as a secondary source with loss of localization of the primary source. The inference is that one can increase the local level in a sound system by up to 10 dB from a secondary delayed loudspeaker (e. g., under the balcony) before it is detected and heard in its own right without a shift from the primary source. This is not the case; at +10 dB Haas predicts that the secondary source will sound “equally loud” which, by definition, means that the secondary source is clearly being detected as such. In fact, for the secondary source or signal to be just imperceptible for time delays of between around 10 to 25 ms, the secondary signal can only be about 4 to 6 dB higher than the level of the primary signal at the listening position.
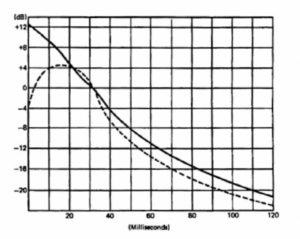
In Figure 26, the dotted line (after Meyer and Shodder) presents a curve of echo’ perception versus delay and source level differences. This useful curve shows that delayed sounds become readily discernible at delays in excess of 35 ms. For example, at 50 ms delay, a secondary signal has to be more than 10 dB lower before it becomes imperceptible, and more than 20 dB lower at 100 ms. The solid curve in Figure 26 tells us when a delayed sound will be perceived as a separate sound source and ceases being integrated with the direct sound.
Figure 26. Echo perception curve.
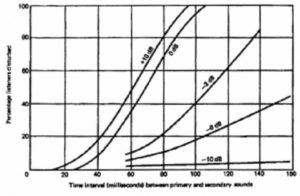
A third useful piece of data relating to time delay and secondary source echo perception is shown in Figure 25. The graph provides an insight into the likelihood of an echo or secondary source causing disturbance to a listener. For example, when the primary and secondary sources are of equal level and have a 30 ms delay between them, less than 5% of listeners will be disturbed. With secondary sources more than 10 dB lower, Haas determined that only a few percent of listeners would be disturbed, although from Figure 25 it can be seen that such echoes would be clearly heard.
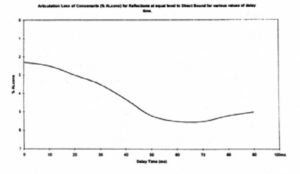
Although potentially annoying, echoes may not degrade intelligibility as much as is generally thought. Figure 27, based on the work of Peutz, shows the reduction in %Alcons, caused by discrete late sound arrivals or echoes. The figure starts at just below 2% with no delay, since this was the residual loss of speech information for the particular talker and listening groups used in conducting the experiment. As the figure shows, typically only 4 – 5% loss was measured. This means that a correction factor of only around 2 – 3% additional loss needs to be added to the total ALcons for a given system.
Figure 27. Effect of echoes on %ALcons*
The data discussed above are based on the effects of single reflections. In large reverberant spaces, a series of reflections will occur and may integrate together, becoming potentially more disruptive. Such late reflections can degrade intelligibility even though they may not be perceived as discrete echoes in themselves. This is particularly true when the intelligibility is already degraded by the normal reverberation of the space. For example, if the reduction in %ALcons is 10% due to reverberation, it could be further reduced by say 3% due to an echo, resulting in 13% ALcons and creating a condition that is unsatisfactory. This assumes no loss of intelligibility due to the person talking, which may add 1 – 2% further reduction, even for well articulated speech. This may result in borderline articulation.
Too many widely spaced loudspeakers in distributed systems can cause undesirable delays when their spacing exceeds approximately 50 feet (17 m). This can also occur in systems where a local in-fill loudspeaker is used to provide coverage without signal delay. In the first case, the spacing between speakers should be reduced, or a back-to-back mounting employed. In the remote in-fill case, the arrival times should be brought back into synchronism by means of a delay line.
8. Talker Articulation and Rate of Delivery:
As has already been mentioned, the individual articulation of talkers can have a profound effect upon intelligibility as perceived by the listener. Peutz found that even good talkers could cause 2 – 3% additional loss, and poor ones up to 12.5% additional loss. It is therefore prudent to design in a margin for such potential losses. The rate at which a person speaks is also an important factor in reverberant spaces. Considerable improvement in intelligibility can be achieved by making announcements at a slightly slower than normal rate in difficult environments, such as large churches or other untreated venues.
The importance of announcer training can not be overstated, but it is often ignored. Prerecorded messages loaded into high quality, wide bandwidth digital systems can overcome certain aspects of this problem. For highly reverberant spaces, the speech rate needs to be slowed down. This may be difficult to accomplish during normal use, but carefully rehearsed slower recordings can be very effective.
Research has shown that intelligibility is improved when the lips of the talker can be seen. At low levels of intelligibility (0.3 to 0.4 AI) visual contact can produce improvements up to 50%. Even with reasonably good intelligibility (0.7 to 0.8 AI) improvements up to 10% have been observed. This suggests that paging systems may have a more difficult task than wilt typical speech reinforcement systems with visual cues.
No sound reinforcement system is without its limitations, and they need to operate in acoustically acceptable environments. It has been found that feeding back a slightly delayed or reverberated voice signal via headphones to the talker can be a very effective way of slowing the talker’s rate of speech.
9. Uniformity of Coverage:
When working in noisy and/or reverberant spaces, it is essential to provide uniform direct sound coverage level. While a 6 dB variation (+3 dB) may be acceptable under better conditions, such a variation in a reverberant space can lead to intelligibility variations of 20 to 40%. A 40% degradation of clarity under such conditions is usually unacceptable. Again, the off-axis performance of the selected loudspeakers becomes of critical importance. Where the listeners are free to move around, as in a shopping mall, then it may be possible to relax the variation in intelligibility within the space. However, with a seated audience in an enclosed space, no such luxury can exist if all are to adequately hear and understand.
An allowable variation in direct sound coverage of 3 dB or less should be aimed for, particularly over the range 1 – 5 kHz. This is a stringent and often costly requirement. To put this into perspective, assume that in a given space with a reverberation time of 2.5 seconds, a preliminary design shows that an on axis value of 10% AICW1, can be achieved. From Figure 23, it can be seen that reducing the D/R ratio by 3 dB will reduce the intelligibility to 20% ALcons – an unacceptable value. It is therefore vital to consider the off-axis positions and the uniformity of coverage, particularly when we recall that the S/N ratio will also be similarly degraded and will contribute additionally to reverberation based losses.
10. Equalization:
Even loudspeakers with nominally flat frequency response, when turned on for the first time, may produce anything but flat response on the analyzer screen, Any major discrepancies in frequency response will of course have an adverse effect on the intelligibility and clarity of the sound system. The five main reasons for response anomalies in sound systems in enclosed spaces are:
1. Local boundary interactions (see Figure 8)
2. Mutual coupling or interference between loudspeakers
3. Irregular sound power interacting with reverberation characteristics of the space
4. Incorrectly loaded loudspeaker (e. g., a ceiling loudspeaker with a too-small back can and/or highly resonant enclosure)
5. Inadequate coverage, resulting in dominant reverberant sound off-axis. To these may be added abnormal or deficient room acoustics exhibiting strong reflections or focusing.
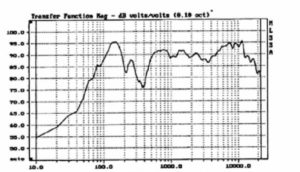
An example of the effects listed in items 1 – 3 above is shown in Figure 28. This is a measurement made on a sound system comprising a number of a short column loudspeakers mounted on the structural piers of a reverberant church. The anechoic response of the loudspeaker is reasonably flat and extended at high frequencies. Because the measurement (listening) position is beyond critical distance, the reverberant field dominates, and it is the total acoustic power radiated into the space that determines the overall response. Figure 29 illustrates the concept. Many distributed sound system loudspeakers do not exhibit flat power response but almost always have a rising response at low frequencies. This coupled with the longer reverberation time at low frequencies characteristic of many stone or dense structure buildings results in an overemphasis at low frequencies. The peak in the response at 400 Hz is due to a combination of mutual coupling of loudspeakers and local boundary interactions. The resultant response causes a considerable loss of potential intelligibility as high frequency consonants are masked Equalizing the system, as shown by the dotted curve, improves clarity and intelligibility significantly. Figure 30 presents a house curve response suitable for distributed systems. This is a guideline only, but has proved to be a good starting point for many systems. Interestingly, the equalized response shown in Figure 29 does not exactly match the recommended curve, since extending the high frequency response produced an overly bright, shrill sound. This is due to the discrepancy between the sound power (reverberant response) and the nominal direct field sound response (traditional reference response) of the loudspeaker.
Figure 28. Response of distributed system in reverberant space.
Loudspeaker System Response in Reverberant Space
with and without Equalisation
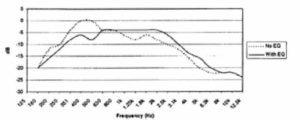
Figure 29. Loudspeaker coverage, direct and reverberant contributions.
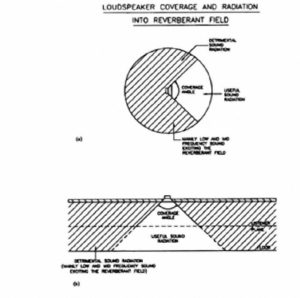
Figure 30. Speech reinforcement “house curve”.
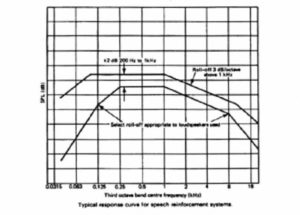
Typical response curve for speech reinforcement systems.
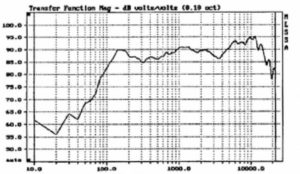
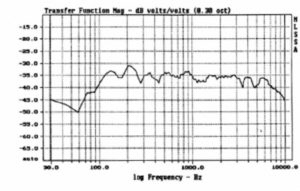
When a loudspeaker with smooth power response that essentially follows its direct on-axis response is used in a sound system, less high frequency rolloff will occur, and it may thus be possible to extend the high frequency equalization curve. This is often the case in well controlled environments where the listener is within critical distance of the loudspeaker. An example of this is shown in Figure 31, which shows the in situ measurement of a laterally distributed system using 2-way loudspeakers. The reverberation time is 0.6 s and C50 is clearly positive.
Figure 31. Distributed system with high D/R response
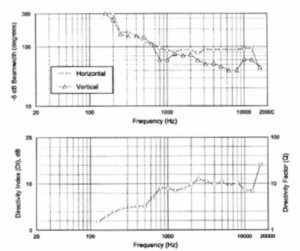
The off-axis and sound power responses of a loudspeaker are often forgotten parameters. Speakers exhibiting a well controlled, smooth response without excessive attenuation within the nominal coverage angle should be used. As target examples of proper response, Figure 32 shows the directional data for the JBL SP215-9 full range sound reinforcement loudspeaker.
Figure 32. Distributed system with high D/R response.
Electronic equalization is a powerful tool and can make a remarkable difference in the clarity of a system. However, it needs to be carried out carefully and with a full understanding of what is happening acoustically. Remember that response peaks can usually be attenuated, but sharp response notches are generally acoustic in origin and cannot be ‘fixed’ by simple frequency domain equalizers.
Adding bass to a sound system might make it sound impressive but will do nothing for its clarity and intelligibility. Indeed, in a reverberant or even semi-reverberant space, too much bass will adversely affect clarity. Nevertheless, many operators, DJs and announcers actually think that more bass makes their voices sound better! In some cases it may be useful to design a system with two signal input paths; one for speech with a carefully determined LF rolloff, and the other tailored for music. Designers have long known that flat response in sound reinforcement systems often causes more problems than it solves, and the traditional house curves used in the industry invariably show a controlled rolloff above about 1 or 2 kHz.
11. Speech Intelligibility Criteria: Measurement, Assessment and Estimation Techniques:
Sections 5 & 6 introduced a number of criteria for judging system performance in the areas of speech intelligibility and clarity. We will now present a more detailed and comprehensive discussion of this information:
Word Scores and Sentence Intelligibility:
The fundamental measurement of intelligibility assessment is of course speech itself. Over the years a number of techniques have been developed to directly rate speech intelligibility. The initial work was carried out in the 1920s and 30s and was associated with telephone and radio communication systems. From this work the effects of noise, S/N ratio and bandwidth were established and subjective testing methods were formulated. The sensitivity of the various test methods was also established, and it was found that tests involving sentences and simple words, while easiest to conduct, were the least sensitive to corruption and did not always provide sufficiently detailed information for system analysis.
The need to ensure that all speech sounds were equally weighted led to the development of phonemically balanced (PB) word lists. Lists with 32, then 250 and finally 1000 words were developed. Tests using nonsense syllables (logatoms) were also produced. These provide the most sensitive measure of speech information loss but are complex and very time consuming in application. The MRT (Modified Rhyme Test) was developed as a simpler alternative to PB word lists and is suitable for use in the field with only a short training period. (The more sensitive methods can take several hours of training before actual testing can begin.) The various methods and their inter-relationships are shown in Figure 11, where the Articulation Index (AI) is used as the common reference.
Articulation Index:
The Articulation Index was one of the first criteria and assessment techniques developed to use acoustical measurements and relate these to potential speech intelligibility, AI concerns the effects of noise on speech intelligibility and was primarily developed for assessing telephone communications channels. Later, corrections were added in an attempt to take account of room reverberation time, but the method is not considered sufficiently accurate for present-day needs. AI remains a very accurate means of assessing the effects of noise on speech. ANSI Standard S3.5 1969/1988 specifies the methods for calculation based on measurements of the spectrum of the interfering noise and the speech signal. The index ranges from 0 to 1, with 0 representing no intelligibility and 1 representing 100% (total) intelligibility. See Kryter (1962).
Articulation Loss of Consonants (%ALcons):
This method, developed by Peutz during the 1970s and further refined in the 1980s, takes into account noise and reverberation effects and is the most widely used method currently available. The criteria for the various degrees of intelligibility are set out in Figure 22, however, the measurement of a system to determine whether it has met the desired criteria is not as well established. The TEF analyzer incorporates a sub-routine for doing this and is one of the few instruments to do so. The intelligibility module of JBL SmaartPro is also able to do this.
A significant limitation of the measurement method is that it uses only the 2 kHz band. For natural speech, where there is essentially uniform directivity among talkers, single-band measurements can be quite accurate. Sound system response is usually far from linear, and considerable errors can occur, particularly when measuring high-density distributed sound systems. However, where devices exhibiting a uniform directivity are involved, good correlation between the calculated data and word score intelligibility has been established.
Direct to Reverberant and Early to Late Energy Ratios:
Measures such as C50 and C35 have been established for the assessment of natural acoustics in theaters and concert halls, A well defined scale has not been developed, but it is generally recommended for good intelligibility in such venues that a positive value of C50 is essential and that a value of around +4 dB C50 should be targeted. (This is equivalent to about 5% ALcons. Measurements are usually made at 1 kHz, or may be averaged over a range of frequencies. The method does not take account of background noise (usually not a problem in auditoriums), and is not particularly suitable for sound system measurements due to the lack of a defined scale and the fact that it is usually measured only at 1 kHz. See Lochner and Burger (1964).
Speech Transmission Index (STI) and Rapid Speech Transmission Index (RASTI):
The STI technique was developed in Holland during the 1970s and 1980s. While the %ALcons method has become popular in the USA, the STI method is far more widely used in Europe. It has been adopted in a number of European Standards relating to speech intelligibility and Sound Systems design and assessment.
The technique considers the source/room/listener as a transmission channel and measures the reduction in modulation depth of a special test signal as it traverses the channel. Schroeder showed that this was related to the room’s impulse response, and that a wide range of test signals could be used to determine its value, A number of instruments are now available that can measure either STI or RASTI (the simpler, shorter method), including TEF, MLSSA, JBL Smaart and some models of B&K equipment. The full STI technique is a very elegant analysis method and is based on the modulations occurring in normal speech. Measurements are made in the main speech frequency octave bands from 125 to 8 kHz, with 14 individual modulation signals in each band ranging from 0.63 to 12.5 Hz. Because the STI method operates over the entire speech band, it is well suited to assessing sound system performance. The RASTI method is restricted to fewer modulation signals in only the 500 Hz and 2 kHz bands; even so, it still takes account of a wider frequency range than the D/R or %ALcons techniques.
The ST1/BASTI scale ranges from 0 to 1; zero represents complete unintelligibility and represents perfect sound transmission. Good correlation exists between the STI scale and subjective word list tests. As with all objective electroacoustic measurement techniques, STI does not actually measure the intelligibility of speech, but only certain parameters that correlate strongly with intelligibility. It also assumes that the transmission channel is linear. For this reason an STI measurement can be fooled by certain system nonlinearities or time-variant processing. For example, discrete, late arriving echoes can corrupt the results, as they can with any of the measurement systems we have described. A significant advantage of STI is that it automatically takes into account room background noise directly in the measurement itself. The basic equation for STI modulation reduction factor m(f) is:
Table 2. RASTI and Alcons Measurements.
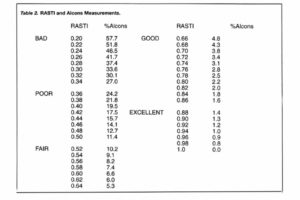
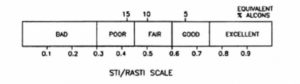
Unfortunately, this equation cannot be solved directly, making STI prediction a complex procedure requiring a detailed computer analysis of the sound field. The approximate relationship between RASTI and %Alcons however has been established and is given below. Figure 33 relates the two scales.
The data presented in Table 2 shows the approximate correspondence between RASTI measurements and %ALcons calculations or measurements:
Figure 33. STI/RASTI versus ALcons scale.
The SII (Speech Intelligibility Index) – 1997) is closely related to Articulation Index (AI). SII calculates the effective signal-lo-noise ratio for a number of frequency bands related to speech communication. Several procedures with different frequency domain resolutions are available, including 1/3 octave and one octave, a 21-band critical bandwidth analysis, and an analysis based on 17 equally contributing bands. The method is suitable for direct communication channels rather than sound reinforcement systems.
12. Speech Intelligibility Optimization: Summary of Main Techniques:
It is worth remembering that sound quality and intelligibility are not the same thing. Often, a deliberately shaped system response with little bass and perhaps an accentuated HF range can be clearer than a ruler-flat, distortionless system. The following tips will prove useful in optimizing the intelligibility of a system:
* Aim the loudspeakers at the listeners, and keep as much sound as possible off the walls and ceiling.
* Provide a direct line of sight’ between loudspeaker and listener.
* Ensure an adequate bandwidth, extending from at least 250 Hz to 6 kHz, preferably to 8 or 12 kHz.
* Avoid frequency response anomalies. Roll off the bass and ensure adequate but not excessive high frequency response. Try to avoid mounting loudspeakers in corners unless local boundary interactions can be effectively overcome. Minimize the distance between the loudspeaker and listener.
* Ensure a speech S/N ratio of at least 6 dBA, preferably >10 dB-A.
* Ensure the microphone user is adequately trained and understands the need to speak clearly and slowly in reverberant environments. *Provide a quiet area or refuge for the announcement microphone or use an effective close talking, noise canceling microphone with good frequency response.
* Avoid long path delays (>ms). Use electronic delays and inter-speaker spacing of less than 45 feet (15 m).
* Use automatic noise level sensing and gain adjustment to optimize S/N ratios under varying noise conditions.
* Use directional loudspeakers in reverberant spaces to optimize D/R ratios. Models exhibiting flat or smoothly controlled sound power response should be used if possible.
* Minimize direct field coverage variations. Variations of as little as 3 dB can be detrimental in live spaces.
* Consider making improvements to the acoustic environment. Do not design the sound system in isolation; remember, the acoustical environment will impose limitations on the performance of any sound system.
* Under very difficult conditions, use simple vocabulary and message formats.
Bibliography & Further Reading:
Ahnert, W. & Steffens, Sound Reinforcement Engineering. Spon, London (1999).
Bistafa, S. & Bradley, J., “Revisiting Algorithms for Predicting the Articulation Loss of Consonants ALcons”, J. Audio Engineering Society,
volume 46, number 6 (June 2000).
Bradley, J., “Relationships among Measures of Speech Intelligibility in Rooms”,- J. Audio Engineering Society, volume 46,
number 5 (May 1998).
Berwick, J. (ed), Loudspeaker and Headphone Handbook., Butterworths, London (1988).
Davis, D. & C, Sound System Engineering, Howard Sams, Indianapolis (1987). Eargle, J., Sound System Design Reference Manual, JBL Professional (1999).
Eargle, J., Electroacoustical Reference Data, Van Nostrand Reinhold (1994).
Fletcher, H., Speech and Hearing, Van Nostrand, New York (1929).
Haas, H. “The influence of a single echo on the audibility of speech,” Acustica. 1, 49 (1951); reprinted JAES, 20 (1972).
Houtgast, T. & Steeneken, H, “Envelope Spectrum and Intelligibility of Speech in Enclosures,” presented at IEEE-AFCRL 1972 Speech Conference.
Klein. W., “Articulation loss of consonants as a basis for the design and judgment of sound reinforcement systems,” AES 1st European Convention, Cologne (1971).
Kryter, K., “Methods for the Calculation and Use of the Articulation Index,” J. Acoustical Society of America, volume 34, p. 1689 (1962). Lochner, J. & Burger, J., Acustica, volume 8, number 1 (1958).
Mapp. P., “Sound Out of Doors,” Sound & Video Contractor vol. 18, no. 1 (Jan. 2000).
Mapp, P., “The Loudspeaker-Room Interface,” Hi-fi News & Record Review vol. 20, no. 8 (1981).
Meyer, E. & Schodder, C, Gottinger Nachrichten (Math. Physic. Kl. 1 la (1962)
Peutz, V M A., “Articulation loss of consonants as a criterion for speech transmission in a room,” J. Audio Engineering Society, volume 19, number 11 (1971).
Peutz. V M A., “Speech Intelligibility,” AES 75th Convention, Paris (1984).
Smith, H., “Acoustic Design Considerations for Speech Intelligibility,” J. Audio Engineering Society, volume 29, number 6 (June 1981). Steeneken, H. & Houtgast, T, “Some Applications of Speech Transmission Index (STI) in Auditoria,” Acustica, 51, 229-234 (1982).
Steeneken, H. & Houtgast, T. “RASTI: A Tool for Evaluating Auditoria,” Bruel & Kjaer Technical Review, No. 3 (1985).
Wallach, H. et al., Am. J. Psychology, 62, 315 (1949).
ANSI Standard S3.5- 1969/1988, Methods for the Calculation of Articulation Index.
I EC 289/BS 90286 – 16, Objective Rating of Speech Intelligibility by Speech Transmission Index (1998).
EC 849/BSEN 60849 (1998), Sound Systems for Emergency Purposes.
ANSI Standard S 3.5 1997, Methods for the Calculation of the Speech Intelligibility Index (Sll).
Mapp. P & Doany. P., “Speech Intelligibility Analysis and Measurement for a Distributed Sound System in a Reverberant Environment,”
AES 87th Convention, New York (1989).
Mapp, P., “How Loud is Loud Enough?” Sound & Video Contractor, vol. 14. no. 1 (Jan. 1996).
Mapp, P., “Practical Limitations of Objective Speech Intelligibility Measurements,” AES 102nd Convention, Munich (1997).
Mapp, P., “Some Effects of Equalization and Spectral Distortion on Speech Intelligibility”, Proc. IOA vol. 19, pt 6 (1997).
Mapp, P., “Objective Speech Intelligibility Testing of Sound Systems,” Proc. IOA vol. 21, pt. 5 (1999).
Mapp, P., “Reaching the Audience,” Sound & Video Contractor vol 17, no. 11 (Oct. 1999).

JBL Professional
8500 Balboa Boulevard, PO Box 2200
Northridge, California 91339 U.S.A.
H A Harman International Company
Editor’s Note: Written by Peter Mapp, and republished courtesy of Peter Mapp and Harman Professional, this technical note is Volume 1, No. 26, entitled “Speech Intelligibility- a JBL Professional Technical Note”. Peter Mapp has over 30 years experience in acoustics & audio consultancy. Peter Mapp & Associates was established in 1984 as a specialist consultancy and is now in its 25th year. We are pleased to bring Pro Audio Encyclopedia readers this excellent introduction to psychoacoustics.