by David Lloyd Klepper
Yeshivat Beit Orot, Shmuel ben Adiya 1, Mt. of Olives, Jerusalem 97400, Israel ddaveklepper1@gmail.com
I. Introduction
The first question this paper attempts to answer is “Has the ratio of early to reverberant sound energy largely replaced Reverberation Time as the primary measurable acoustical phenomenon for judging intelligibility of both music and speech?. This metric is also defined, acoustically, as Clarity (some also use Definition), and 80 milliseconds separates the two regions for music, 50 milliseconds for speech.1 These metrics are abbreviated as C80 and C50. Other authors find this metric of value for both evaluation measurement and for design.2-9 Data is analyzed, showing C80 is of value and a possible replacement for Early Decay Time, EDT, the time required for sound to decay 10 dB after the source ceases times six. The time between arrival of direct sound and the first reflected sound, is also discussed in relation to subjective clarity.
The second question is “How did the use of sound-reflecting panels develop? Dr. Leo L. Beranek’s work in noise control has been considered so important that it is a part of general American history, particularly with regard to aviation.10 He was also one of the most important educators, authors, and innovators in the field of acoustics in general.11 Reasonably well-known among acoustical consultants and concert hall architects is his work on seat and audience sound-absorption that brought us more accurate prediction in design of reverberation time characteristics in completed halls and rooms.12,13,14 His company, Bolt Beranek and Newman, was a pioneer in the use of suspended sound-reflecting panels in halls for music. Why these panels are used is recounted in the three concert-hall-opera house books, 1962-2003, with descriptions of the halls with panel arrays and those without such panels.15,16,17 This paper will show the relationship of suspended sound-reflecting panels to the quality of Clarity and recount this development.
The use of suspended sound-reflecting panels in concert halls and opera houses was not universal. Vern O. Knudsen and Cyril Harris never used them, although others applied panels to a few of their halls after a period of use. But a majority of new successful concert halls built after WWII use them as data will show.
The third question regards the possibility of an excellent concert hall that does not conform to the classic shoe-box shape. We will attempt to prove that such halls are possible. And the fourth question concerns the need for a real pipe organ in a concert hall. Is it needed and how can any problems be avoided?
This analysis is presented in honor of the memory two colleagues of mine: (1) William Ranger Farrell, an early teacher of mine at BBN, who was willing to risk his own reputation by transferring responsibility of some of his own clients’ projects to me, despite my then relative inexperience, and who was on the cutting edge of speech privacy acoustics research, including the development of masking noise systems.18, 19 After leaving BBN to start his own firm, he was also helpful to L. Gerald Marshall, Larry King, and me, when we inaugurated Klepper Marshall King, Associates (KMK) in July 1971 (2) Ronald McKay was a pioneer in the design of modified fan-shaped halls that used angled wall panels and overhead reflectors to approximate the acoustical conditions of rectangular concert halls. Pasadena, CA, Ambassador College Auditorium, is an early example. The tent-shaped ceiling at Marie Debartolo Hall, University of Notre Dame, South Bend, is another innovative design. He was the main acoustical consultant to the Wenger Corporation for the early development of the modular prefabricated practice rooms. He was an early advocate of using air casters for moving orchestral stage enclosures in multi-use halls, and pioneered use of high-sound-rated doors and movable walls in performing arts projects, for greater usefulness of space. An example is use of the wing space of a theatre to construct scenery while rehearsals can take place without sound interference. More information can be obtained from reference 10, p. 60, 73, 118, 186, 326-328, 335, and from McKay Conant Hoover, Inc., acoustical and audio-visual consultants.
This paper presents information presented earlier in several papers on the website www.proaudioencyclopedia, and these papers provide additional details, particularly with regard to my and others’ personal history with regard to these ideas.1
II. SOME HISTORY
Wallace Clement Sabine is considered the “father of modern architectural acoustics,” and Boston’s Symphony Hall the well-loved monument to his work. He developed the reverberation time formula and used it in the design of that hall. For many years reverberation time, T60, was considered by far the most important room-acoustics metric, complimenting attention to noise control and sound isolation for successful assembly space design. As noted, later, L. L. Beranek proved that many post-WWII halls did not meet their design goals because audience sound-absorption was underestimated, with more comfortable and more widely-spaced seats. He proved that the audience sound-absorption should be based on seating area, not the number of seats.12,13,14
Based on the Sabine’s pioneering work, criteria for speech acoustics give one set of criteria for optimum reverberation times for different halls’ volumes, for orchestral music a higher set, and for choral and organ music a still higher set. The subjective quality of clarity was believed dependent entirely on the inverse of reverberation time for particular sized halls.20 Dr. Beranek’s work on chair and audience absorption did not modify that design approach.
The work of P. H. Parkin and J. H. Taylor challenged this assumption regarding speech in 1952 by introducing the concept of the Direct-to-Reverberant sound energy ratio.21 At St. Paul’s Cathedral, London, the direct sound came from a loudspeaker system that both minimized the amount of reverberant energy and also closely matched time of arrival at listener’s ears with direct sound from the preacher’s voice. Others including W. Reichardt, U. Lehmann, A.C. Gade, J. H. Rindel, J. S. Bradley, L. G. Marshall, modified the idea to the Early-to-Reverberant ratio, because all early sound (in nearly all real situations) contributes to subjective clarity. They found 50 ms the statistically valid dividing point between early and late for speech and 80 ms. for music.2-9 Thus, arose the abbreviation C80 for an acoustic metric Clarity in evaluating music acoustics and C50 for speech.
W. Reichardt and U. Lehmann wrote the following as an English Language summary to a 1974 German language paper:4
“As is to be expected, there is a significant negative correlation between room impression R and Clarity C. The correlation factor, rCR, is, however, only -0.77. Therefore, these two quantities, R and C, must be separately defined, calculated and measured. The reverberation time leads to a certain anticipated value. The initial reflections lead, however, to significant deviations from this anticipated value. These deviations, as opposed to the statistical distribution of sound in a room, give a reason for the good and poor seating positions in an auditorium.
“It is possible to enhance both room impression and clarity when reflections arrive at the ear, either laterally, or from the ceiling or the rear wall with a delay of 25 to 80ms. The pairs of values of R (RT) and C80 in real concert halls group themselves around equal values of the ratios, fstat of statistical energy arriving from the front to ambient statistical energy for different reverberation times. Although the reverberation time in a room is a constant we see that for different ratios of frontal to ambient energy containing, as they do, the reflected energy, this is subjectively equivalent to a variation in reverberation time in the middle of the auditorium the frontal energy is higher and the impression clearer than would be expected on statistical distribution of energy grounds.”4
Thus, C80 is important for music and may, for music, replace Early Decay Time, EDT, time required for sound energy to decay 10 dB after the sound source ceases times six. Data, from both a completed multi-use hall and also from the References 15, 16, and 17 are analyzed and support this hypothesis. This data and past work also indicate that the “Initial Time Delay Gap,” ITDG, or T1, may be more important for clarity than for intimacy, again regarding music. A recent paper by Kuusinen, Patynen, Tervo, and Lokki presents an analysis that indicates early lateral reflections are possibly of greater importance than the Initial (Time) Delay Gap for a sense of intimacy, but this paper does not provide values of T1.9
Figure 1 decribes Boston’s historic Holy Cross Cathedral (Roman Catholic). In the summer of 1954, the Boston Diocese wished to end the practice of renting sound systems, and contacted DeNambro Radio and Supply for a proposal. DeNambro then asked BBN for a system design. Dr. Leo Beranek had heard of the St. Paul Cathedral installation, and worked with DeNambro to design and install a test system based on the St. Paul design. No addition of sound-absorbing material for reverberation-time reduction was permitted because of the musical requirements, a situation similar to that at London’s St. Paul. The system’s basic design and that of the system that was finally installed thirty-five years later, based on that design, are shown in Figure 2 in these references.22 ,23
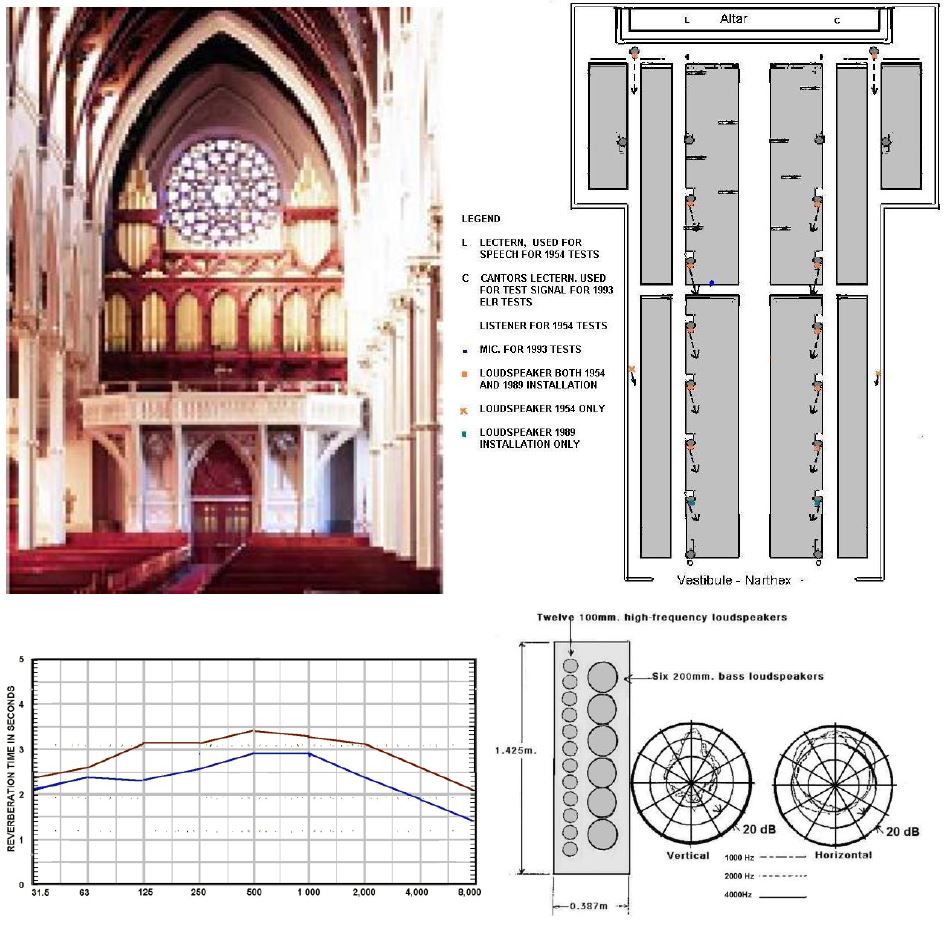
Figure 1, Boston’s Holy Cross Cathedral Top left, looking to the rear and to the choir gallery with the Hook and Hastings 1875 organ; Top right: the loudspeaker plan for L. L. Beranek’s 1954 test system and the 1989 installation; Lower left: measured reverberation time characteristics, upper curve empty and lower curve full; Lower right: description of the Bozak 888 column loudspeaker used in the 1989 installation.22,23 Organ CDs available.
In the autumn of 1954, Dr. Beranek’s M.I.T. Electroacoustics class became the test subjects for the test system’s intelligibility testing. (The author was in the class.) The experiment was a success, but for whatever reason, the Diocese decided not to proceed with a permanent installation at the time.22
After joining Bolt Beranek and Newman on 1 May 1957, the first opportunity I had to apply this idea was at Westfield, New Jersey’s First Methodist Church. Wilma Jensen was the church’s Organist and Music Director, and she hoped that intelligibility could be improved without adding sound-absorption to reduce the reverberation time. The church had both a new Aeolian Skinner organ and a new sound system. The latter used ten Altec (Western-Electric-designed) 755A loudspeakers five along each side wall, causing more reverberation than clarity. Upon my recommendation, these were replaced by one Altec multicellular horn, aimed to avoid sound-energy toward sound-reflecting wall and ceiling surfaces and to evenly cover the congregation, and so increase the ratio of early-to-reverberant sound energy. In Figure 2, “my” muticellular horn has been replaced by a curved-line-source loud-speaker system, capable of wide-frequency-response music reinforcement as well as speech, but still providing the directional control of amplified energy that the multicellular horn did.
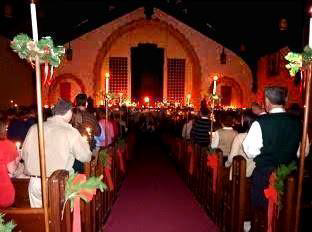
Figure 2. The interior of Westfield, New Jersey’s First United Methodist Church. Installation of an Altec multicellular horn central loudspeaker at the central arch top center of the made sound-absorbing panels unnecessary. The horn-driver combination has been replaced with a newer system with similar direction sound propagation control.
Robert Newman and W. Ranger Farrell at BBN served as consultants to the architect, Wallace C. Harrison at the First Presbyterian Church, “the fish church,” and the author and Howard Rockstrom evaluated it after completion. Intelligibility was good with a two-second reverberation time and with neither any sound-absorbing treatment nor a sound system. However, two congregants talked the church into a sound system with under-pew loudspeakers and then into sound-absorbing panels to mitigate the added reverberant energy produced by that sound system. All this was removed from use with the installation of a new Visser-Roland pipe organ several years ago, replacing the original landmark Allen electronic. In my 1959 paper evaluating the church’s acoustics, I used the words “direct sound” where “early sound” should have been used,24,25 See Figures 3 and 4.
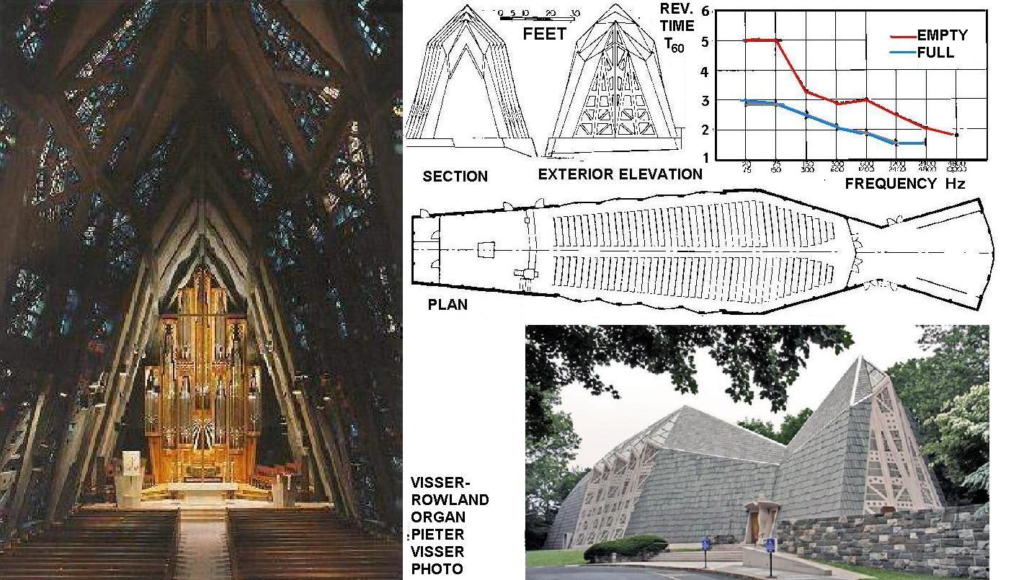
Figure 3, The Stamford, Connecticut’s First Presbyterian Church: Left, the view forward to the Visser-Rowland pipe organ, Top right, two cross-sections, reverberation-time characteristics, and plan; lower right, the exterior view.24,25
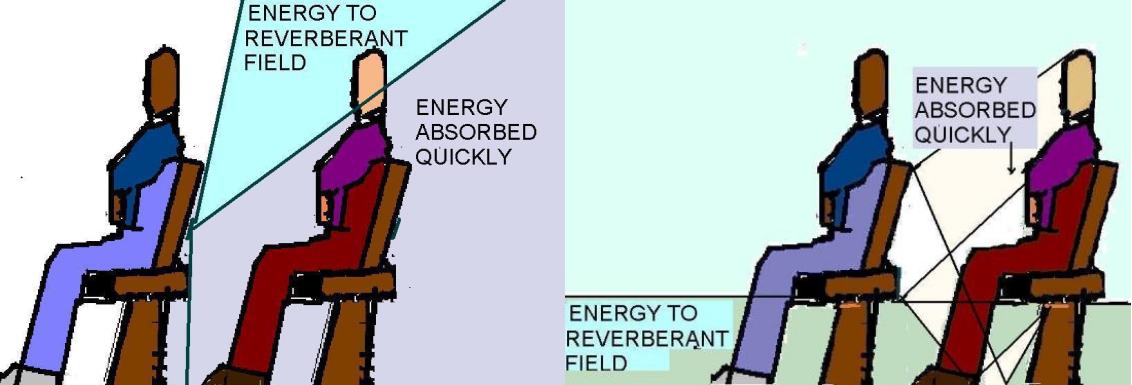
Figure 4. Low-sound-level pew-back sound systems work well in reverberant spaces because only a small portion of the loudspeaker radiated sound undergoes multiple reflections to excite the room reverberation. Under-pew loudspeakers do not work well in reverberant spaces, because a high proportion of sound energy undergoes multiple reflections under the pews and is randomly radiated to ceiling and wall surfaces for further multiple reflections.
At BBN, the concept allowed designing for reverberant concert halls and worship spaces with the speech intelligibility assured by well-designed sound systems. One application of this approach was the multicellular horn sound system installed in Clowes Hall, Butler University, Indianapolis. Russell Johnston, then at BBN, was responsible for the room acoustics with Evans Woollen III and Grant Johansen architects. Bill Hanley was responsible for both the design and installation of the initial sound system. See Figure 5.
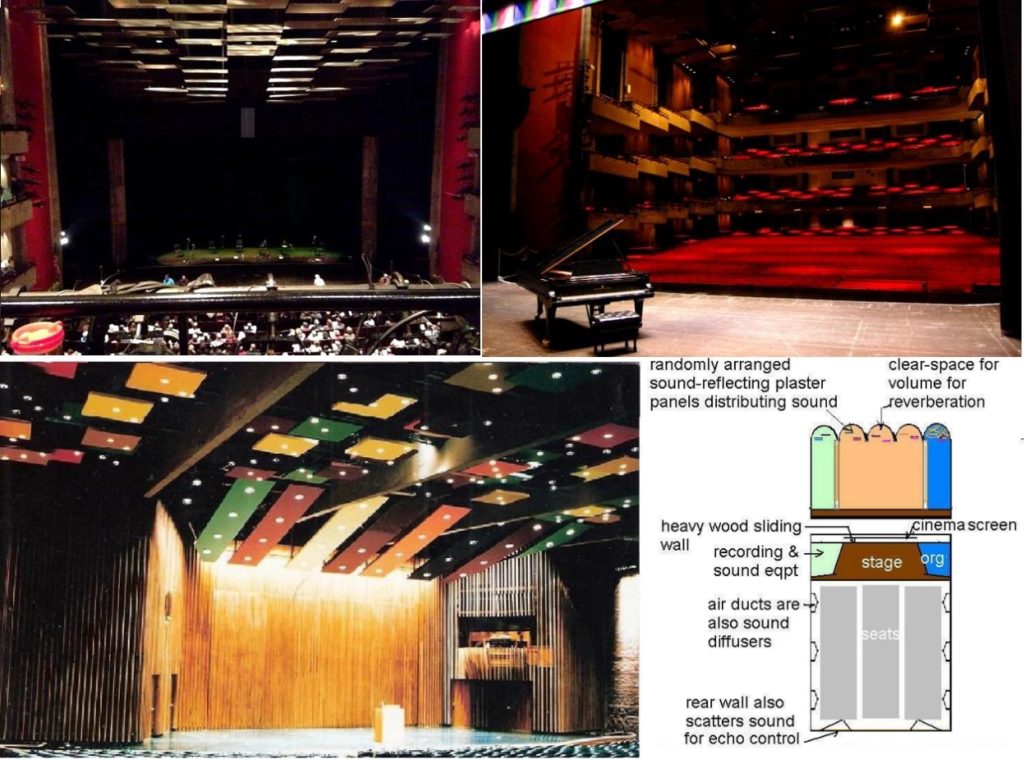
Figure 5. Two early “panel array” BBN halls: Top, Clowes Hall, Butler University, Indianapolis, IN; Lower: Spaulding Auditorium, Hopkins Center, Dartmouth College, Hanover, NH. The original main sound-reinforcement systems’ directional characteristics allowed all surfaces that can be hard and sound-reflecting to be left untreated with sound-absorption. New systems may have replaced the originals, but did not required changes in room acoustics. At Clowes, all types of performances are presented, including orchestral and chamber concerts, theatre, opera, Broadway-type shows, and popular amplified music. Spaulding is used successfully for both concerts and lectures.
The sound system has been upgraded with more modern equipment. Orchestral concerts are accommodated by a standard Wenger 13.5 x 10 meter (45’ x 32’) demountable stage enclosure. This means that a full symphony orchestra is accommodated with the front-row musicians on the pit-lift raised to stage level, forward of the proscenium; and the proscenium is wider than the Wenger enclosure. Despite this compromise, the local reputation of the hall’s acoustics is excellent.
My concert hall project at the time was the Dartmouth College Hopkins Center Spaulding Auditorium, used as both a lecture hall and concert hall. John Volkmann of RCA had visited BBN, provided accurate data on the performance of RCA radial directional horns, and this equipment was used at Dartmouth, after a specification permitting either Altec or RCA equipment. Harrison and Abromovitz were architects, with Walter Colvin as job captain. Also shown in Figure 5.
One of Robert Newman’s important teachers at the University of Texas, Dr. Paul Boner, became famous for his extensive use of narrow-band equalization, but he also used directional control of loudspeaker energy to provide intelligibility in reverberant spaces.26
III. Theory explains practice
Noted earlier, Clarity, (C50 and C80) was important for Room Acoustics for the Europeans: A. C. Gade, W. Reichardt, U. Lehmann, and J. H. Rindel, among others.4,6,9 In North America, J. Bradley, G. W. Seibein, and J. R, Hyde all made contributions,2,5,7,8` However, V. M. A. Peutz continued to base intelligibility predictions on reverberation time, modified by consideration of the directivity of the sound source, using W. Klein’s modified equations for the ratio of sound energy reaching the listener directly to the average that would result if the source were omnidirectional, and depending of course on the distance from source to listener. If the first reflection is louder at the listener than the direct sound, then it replaces the direct sound in calculations.27 Neglecting background noise and considering just room-acoustics, this concept was a marked improvement over reverberation time only, and has provided dependable correlation with intelligibility testing in many tests, especially those involving comparisons between loudspeakers and loudspeaker systems with varying degrees of directional control.28 The equations and the developments dating back to Knudson and Harris are also discussed in the Marshall Long references and are not repeated here.6 Figure 6 is developed from that reference and is possibly the most useful way to their application. Generally, calculations are done for the 2000 Hz octave-band, or for weighted summation 15% at 500 Hz, 25% at 1,000 Hz, 35% at 2,000 Hz, and at 25% 4000 Hz (L. Gerald Marshall’s weighting2). Figure 7 indicates why this is the preferred frequency range to evaluate speech intelligibility.29
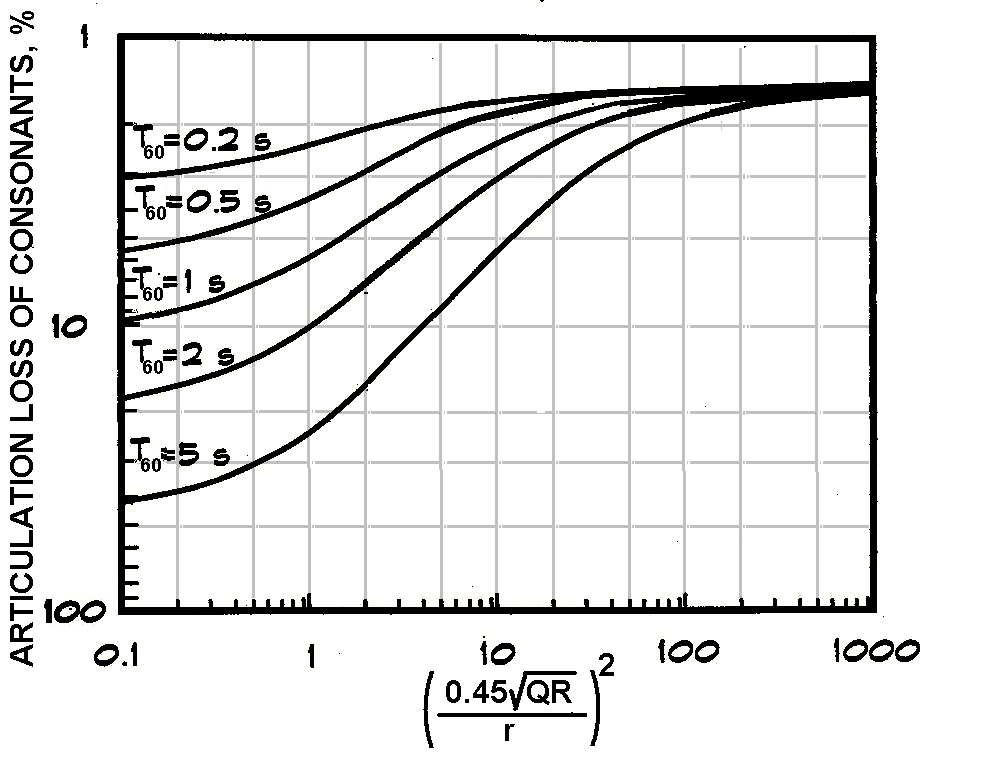
Figure 6. Peutz’s and Klein’s deter-mination of the speech intelligibility from r, the distance in meters from the sound source, Q, the Directivity of the sound source in the direction of the listener, R, the Room Factor or the total absorption in the room in Metric Sabins, also noted elsewhere as aT, and the Reverberation time T60.28
Many have found this procedure difficult in evaluating architectural modifications, such as tilting a five-meter-high ceiling over a lecturer’s platform or adding an appropriate pulpit canopy in a worship space. In both cases, early reflections are increased in strength and/or number, and the reverberant energy at listener’s ears is reduced, without noticeably reducing the reverberation time or requiring its reduction.
The objections of those who deny fusion of early sound for intelligibility was first presented by C. R. Cable and R. C. Emerson, using only electroacoustics testing.30 The idea is that any specific early reflection may be destructive as easily as constructive because of phase interference. This concept is useful when the interference pattern is repeated continuously by a flat plane replaced by a series of steps, as will be discussed later in connection with Philharmonic Hall’s first year. But when reflections are more random than that unusual case, the wavelengths of the frequencies that contribute most to speech are less than the distances between ones ears, and that path-length differences of the reflection to the two ears are certain to insure that absolute cancellation seldom occurs in both ears, and even then only instantaneously. (Refer to Figure 7). Also, in the real world, heads continuously move slightly for both talkers and listeners, and the usual random spread of reflections also eliminates destructive phase cancellation of the added benefit of early reflections.
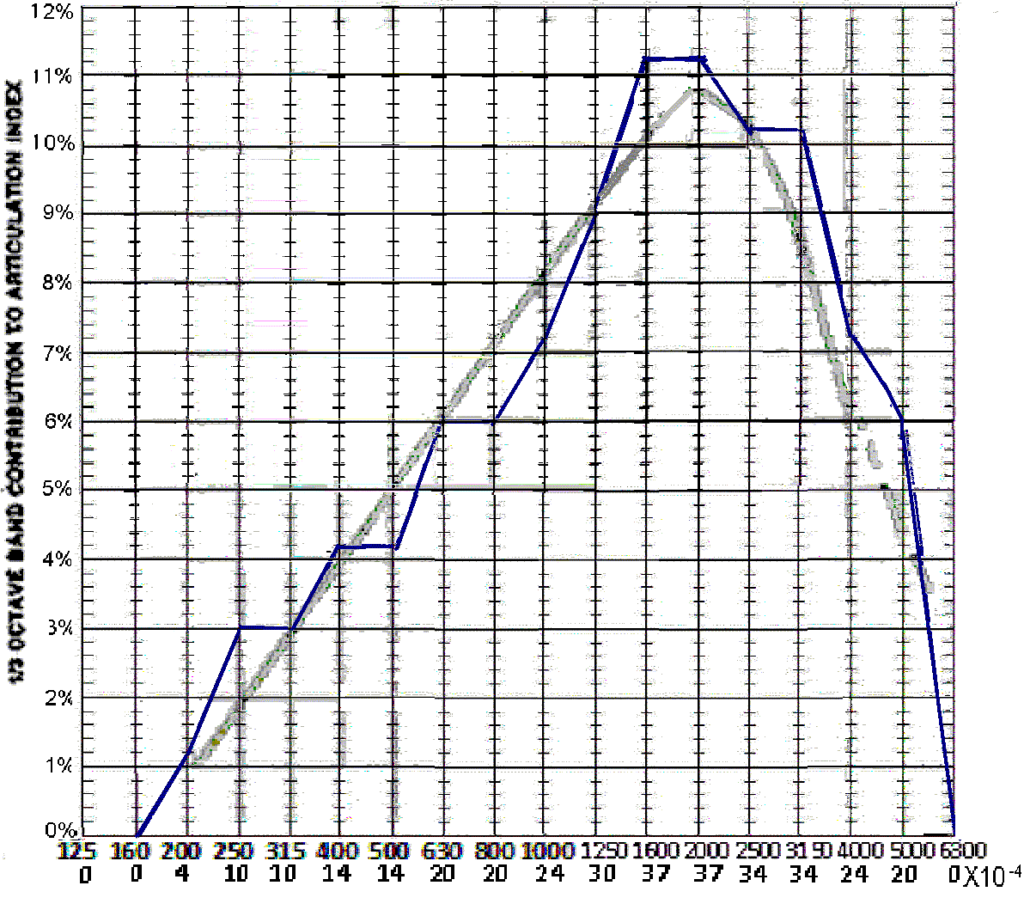
Figure 7: Each 1/3-octave-band contribution to speech intelligibility, Grey: Michael Rettinger’s analysis probably based on work by French and Steinberg, as transmitted to Don and Carolyn Davis.29 In this chart, Rettinger’s data points add up to less than 100%. The dashed lines are this author’s speculation as to where the additional 9.5% belongs. Blue: American National Standards Association S3.5-1967 in blue. The numbers below each 1/3-octave band are the weighting factor times 10^4. The weighting factor multiplies the signal-to-noise ratio in that 1./3-octave-band, and the total from all active bands is the Articulation Index. Excess beyond 30dB is discarded. If all bands have S/N of 30 dB the articulation index is 1. Thus, multiplying each weighting factor by 30 gives the per-cent contribution to intelligibility.
Don and Carolyn Davis have written in support of Emerson and Cable, but their data can support both the Puetz-Klein and Clarity conecpts.29 The Articulation Loss of Consonants numbers that the Crown TEF-20 equipment was giving them were based entirely on the C50 early-to-reverberant sound energy ratio. Also, their experiments were all with regard to loudspeaker propagation, not room design, and the Peutz-Klein concept both worked well in that application and substantially agreed with the Crown TEF readings. Also, both agreed with the participants’ subjective evaluations. Agreement might have been reduced if architectural modifications were being evaluated instead of loudspeakers with different directional characteristics. L. Gerald Marshall states: “..the great differences between natural room acoustics response and recording system response underscore the possible pitfalls in using synthesized sound fields and loudspeaker reproduction for research relating to room-acoustics criteria.”2
South Africans J. P. A. Lochner and J.F. Berger show a sliding scale for reflections from 35 ms. delay to 95 ms. following direct sound. Energy between 35 milliseconds and under 95 ms, found can be helpful or destructive depending on the entire reflection.31 J. Jacek Figwer follows this in his analogue system, but it requires time-consuming hand-analysis.32 The practical compromise for speech appears to be C50 concept for use of the Lochner-Berger work and Figwer’s application, and has proven applicable in a majority of situations where architectural acoustics and/or sound system measures are to be implemented. The known cases where it must be modified to be applicable will be discussed, as well.
IV. Early Decay Time
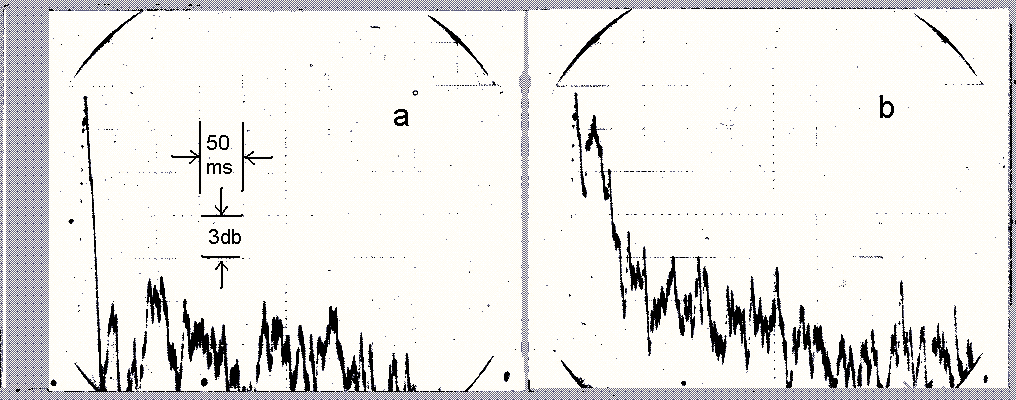
Figure 8. 0sciliscope traces of 1,000 Hz filtered and integrated response to an impulse at the First Baptist Church, Chattanooga, Tennessee, without the sound system, a; and with the sound system, b. The slope of the direct sound is probably more determined by the integrating process and the oscilloscope characteristics. The photographs are reversed in color, enhanced in contrast, and scale division numbers added.32
The time required for sound to decay only ten deciBels instead of sixty deciBels, times six to make the numbers comparable with normal reverberation time, RT10, has considerable acceptance as an important metric in concert hall acoustics. This is abbreviated as EDT, and occasionally crops up in discussions of speech intelligibility. Contrary to Beranek, many find it less important than Clarity and even possibly superfluous if Clarity, C80 for concert halls, C50 for speech, is considered in design and is measured in models, computer simulation, and completed halls. Data taken by Jacek Figwer at the First Baptist Church of Chattanooga, Tennessee (See Figures 9a and 9b.) indicates that finding EDT for natural voice without reinforcement is problematical, because the lack of early reflections (Figure 8-a) gives an EDT of close to zero time. The building, is over 600,000 cu. ft. in volume, with a midband T60 of 3.0 seconds, not indicated on the oscilloscope displaying less than 500 ms. of the decay process. Early sound (Figure 8-b) from a distributed and delayed building-column vertical line-source loudspeaker system replaces poor intelligibility with good intelligibility, but simultaneously increases the EDT instead of decreasing it! Measuring Clarity would indicate the sound system’s intelligibility enhancement.
Possibly the way to use the EDT concept here is to consider the initial sound to be the first reflection, albeit with delay far greater than the Bolt-Doak criteria based on Haas’ work discussed later, rather than on the initial direct sound?
V. Usefulness of C50
“Time-Delay Spectrometry’ (Is delay in any medium or dimension other than time?) was developed by Richard C. Heyser, based on the advancement of audio digital delay devices and computer technology as a powerful measuring technique to provide information on room acoustics, sound systems, sound-isolation, and vibration control and analysis.33 On this basis, Crown Corporation developed the TEF (Time, Energy, Frequency) analyzer. L. Gerald Marshall assisted them in developing a program for measurements of Clarity (as ELR, Early-to-Late Ratio), and the equipment, including a required laptop, is sufficiently light to be transported by one person.2 The technique identifies problems and/or confirms existing problems revealed by the ear; it assigns values on improvements, as the following examples demonstrate.
Re-angling a theatre’s sound-reflecting side-wall and ceiling panels
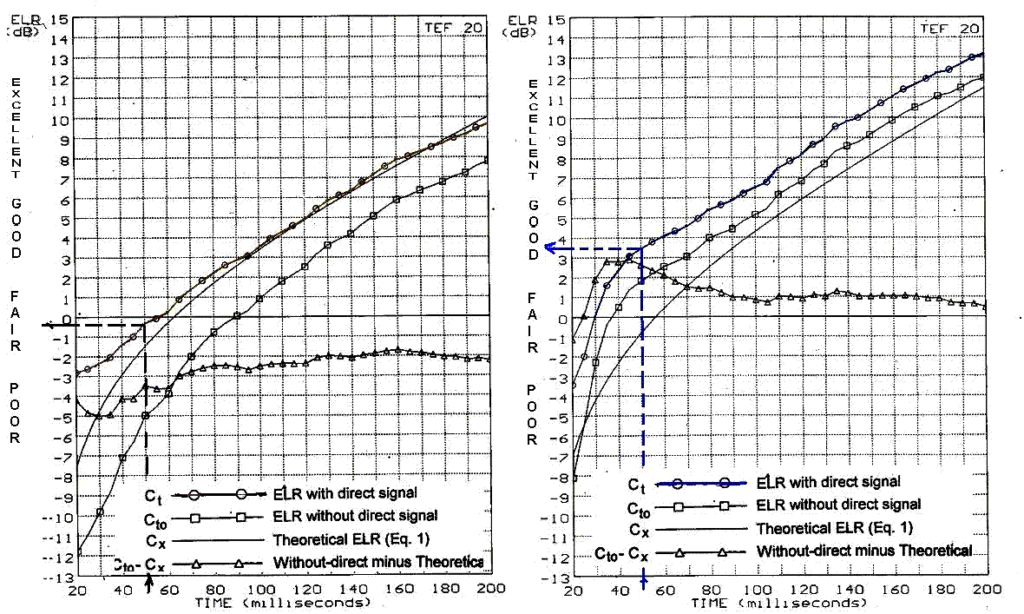
Figure 9. Crown TEF display before (a) and after (b) theatre panel adjustments2
One of L. G. Marshall’s consulting projects produced the before and after TEF-20 readouts of Figure 9 above, copied from Figure 9 of Reference 2. Added here are the intelligibility ratings (poor to excellent) of that reference’s Figure 8 and the dashed marker lines and arrows. The improvement demonstrated was provided by re-angling wall and ceiling sound reflecting surfaces. The usefulness of the other Figure 9 curves, other than the ELR curves, are described in the references.2 They can be valuable in identifying problems and in determining approximately the directivity of a central sound system when such is used. The associated equations are also in the references. The panel re-angling produced a four deciBel improvement for speech in the ELR, or C50, which can also be considered a signal-to-noise ratio. The C50 rating and L. G. Marshall’s assignment of adjectives can be explained from Figure 10 drawn from material in an article by Peter Mapp in Sound and Communications Magazine.35 Marshall’s subjective ratings are more favorable on the good side. P. Mapp’s article also discusses other speech intelligibility metrics, such as the Speech Transmission Index and the Rapid Speech Transmission Index for those interested. Here, we are focusing on C50.
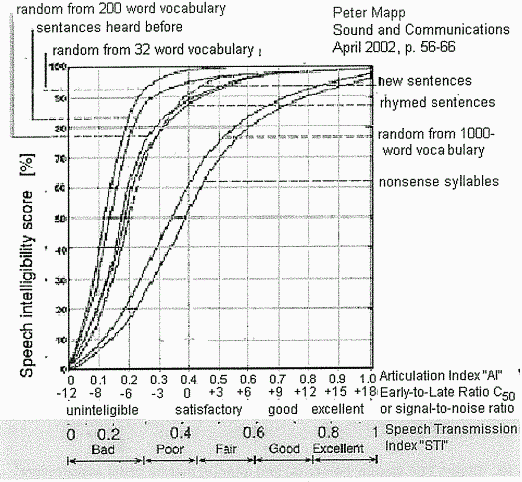
Figure 10. Expected intelligibility test scoring vs. C50 tests. Data obtained from various sources and integrated by Peter Mapp.34 Thanks and congratulations to Peter Mapp who assembled and correlated data from different sources. The author takes responsibility for the shaded addition, applicable for normal English conversation and normal hearing.
St. Thomas Episcopal Church, Fifth Avenue, New York City
The 1967 Chapel at Oklahoma State University, Oklahoma City. Pietro Bellusci architect, was the first pew-back sound-system church. The first system with both pew-back and delay (provided by an acoustical delay tube) was the 1969 National Presbyterian Church in Washington, DC, Harold Wagoner architect.35 In 1971, St. Thomas was the first to use a digitally delay in a pew-back system, and was also one of the two earliest systems employing digital delay anywhere.36 (The Walnut Street Theatre was the other, also 1971, where a proscenium sound-system is supplemented by delayed balcony and underbalcony distributed loudspeakers. St. Thomas used a Lexicon delay, and the Walnut used one by Industrial Research Products. Listening tests informed fine-tuning of both systems, a process later replaced by TEF evaluations.)
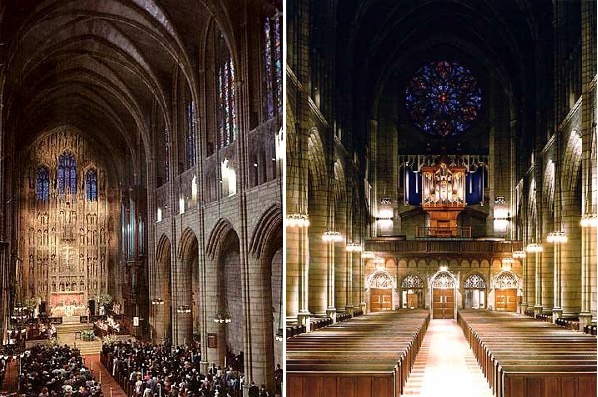
Figure 11, St. Thomas Episcopal Church, Fifth Avenue: Left, view toward the Chancel, Right, view toward the rear balcony and its Taylor & Boody Bach-period organ
St, Thomas Church was built in 1913, designed similar to a French Gothic cathedral. Ralph Adams Cram was the overall design architect and Bertram Grosvenor Goodhue the interior details designer. Reverberation was considered a problem; consequently ceiling areas were treated with an artificial porous stone, Raphael Guastavino’s “Rumford Tile.” Klepper Marshall King was asked for advice to both make this material sound-reflecting, permitting music performed and congregational singing to be supported by the natural reverberation matching the visual appearance of the church, and also to insure high speech intelligibility. With the church authorities educated as to the possibilities of clarity in reverberant spaces, some successful pew-back systems already in operation, and the earlier recommendation by the great organ builder, G. Donald Harrison for a pew-back speech-reinforcement system, we obtained approval. There was some apprehension over the then experimental nature of digital audio delay, but our confidence in the abilities of the two manufacturers was transmitted to the church authorities. A for-bid specification was prepared, and the New York firm Commercial Radio and Sound was awarded the contract. Since 1971, some electronic equipment has been replaced, and the system has proven useful in reinforcement of harpsichords and clavichords, as well as speech.36
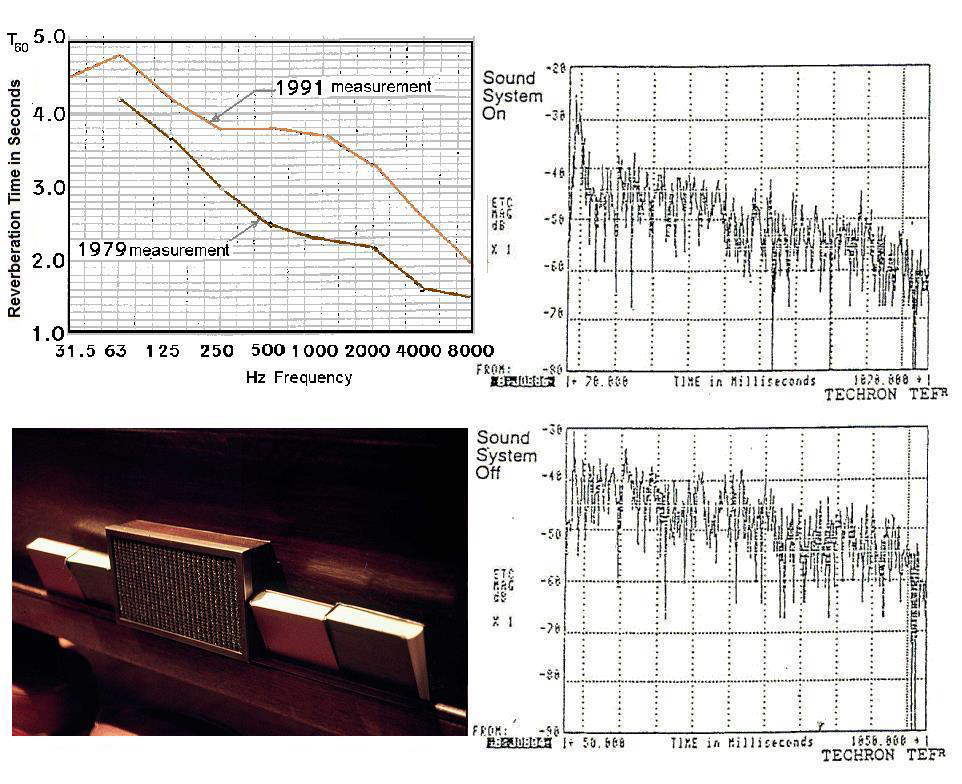
Figure 12, St. Thomas Episcopal Church, Fifth Avenue: Top left, Reverberation Time before and after application to the ceiling of four coats of Kyanize L-0560 sealer and one coat of L-0561 flat finish, after the pew-back sound system installation; Lower left, typical pew-back loud-speaker enclosure; Right, 1991 1.000 Hz Octave-Band energy-time-curves for St. Thomas Church, top with sound system, bottom without sound system. The top curve is depressed 20 dB in absolute level with respect to the bottom curve. Apologies are in order for inconsistency in data presentation, which preferably would all be with the 2,000 Hz octave band. The 1991 data was taken during the TEF development stage, and the data available is used.35 Music CDs are available.
St. Thomas Episcopal and Holy Cross Cathedral Similarities
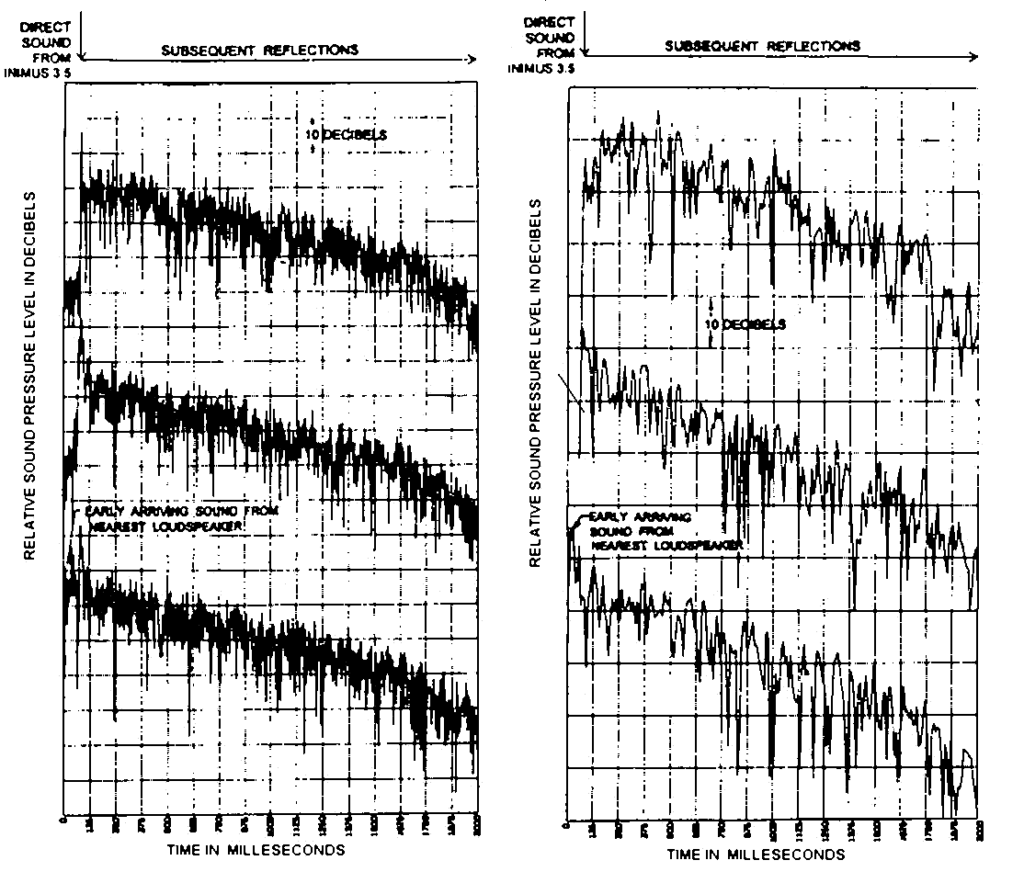
Figure 13. Octave-band energy time curves for Holy Cross Cathedral, left, 2000 Hz, right, 500 Hz. Top without sound system, middle sound system with optima delay settings, and bottom with delays switched off. See Figure 123.
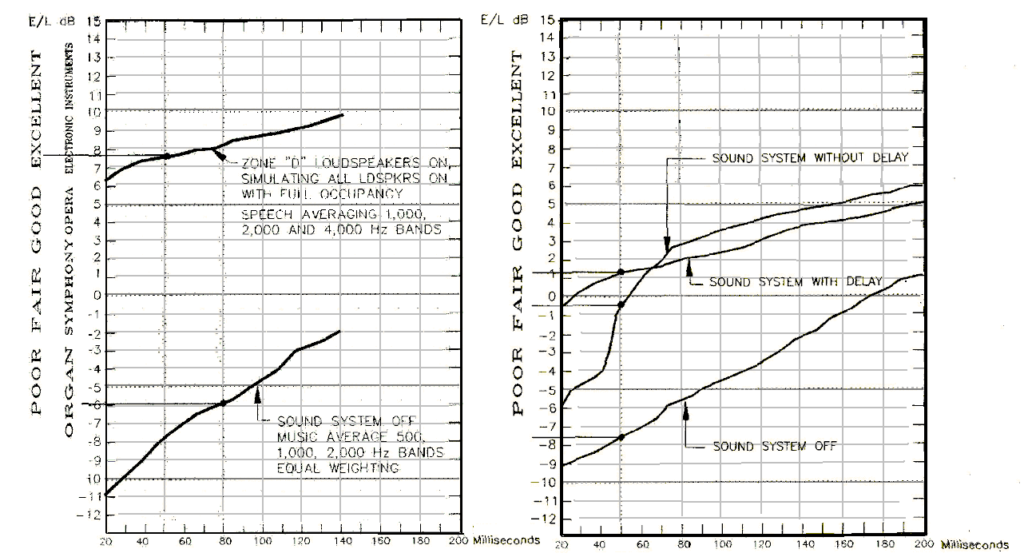
Figure 14. ELR displays, St. Thomas Church left, Holy Cross Cathedral right. Subjective ratings with pointers to the 50ms. (music 80ms.) points , speech weighting unless otherwise shown.36,23
Trinity Episcopal Church, Wall Street
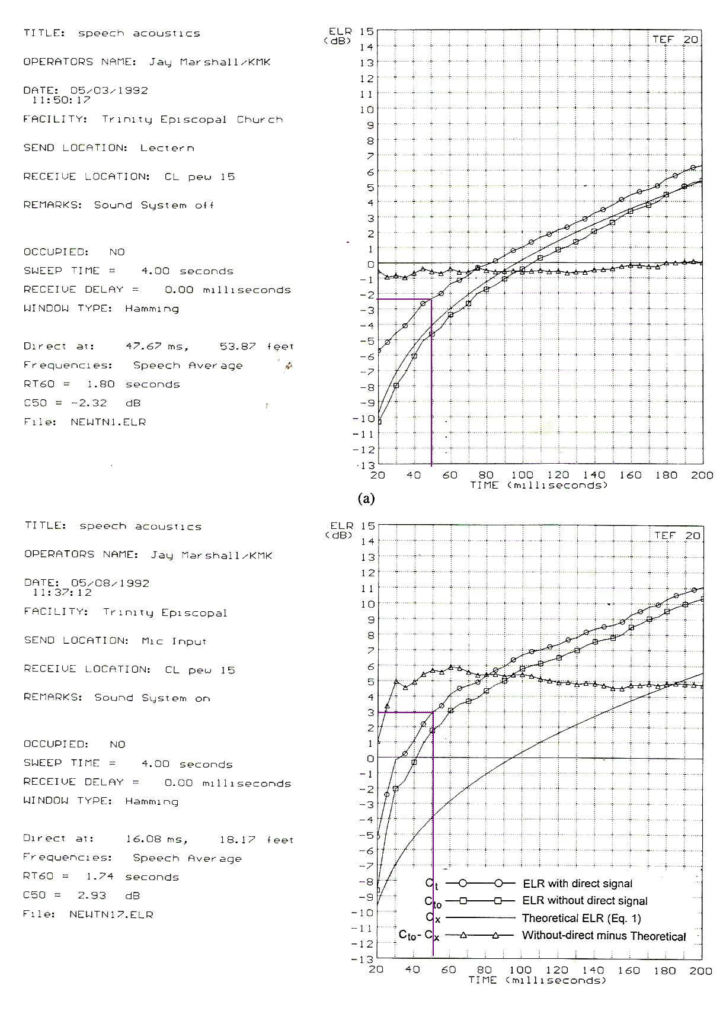
Figure 15, Two typical ELR TEF-20 speech average displays from Trinity Church, Wall Street. Top without sound the sound system and bottom with the sound system. The sound system moves the ELR or C50 ratio from -2.3 to 3, from poor to good.7 Music CDs are available.
The pew-back sound system in this historic church was designed by Edward Seeley, who had been Altec-Lansing’s Chief Engineer for many years, and consulted on sound systems after retiring from that position. Klepper Marshall King was responsible for the first electronic upgrade, to simplify sound system operation and to replace the Ancha Electronics acoustical tube delay unit with a digital electronic delay. This was the first distributed sound system where we used the Crown TEF-20 equipment to set delays. In general, we found the delays that Ed Seeley had chosen were correct, but there were minor adjustments that made for some slight improvement in acoustical performance. There were no changes to the loudspeakers, Altec 405A, or their locations.
Chamber music concerts have been successful (indicated by repeated use and large audiences) in highly reverberant worship spaces, when enough early sound is provided by added properly positioned reflecting surfaces or through electronic amplification. Examples are Boston’s Holy Cross Cathedral and New York City’s St. Thomas Episcopal Church, Fifth Avenue, New York City. In Boston, the early reflected energy and the appropriate C80 are provided by a suitable sound system based on Beranek’s 1954 experimental sound system to improve speech intelligibility in the Cathedral.22,23 The Cathedral’s permanent system was designed with the possibility of music reinforcement as well as speech, and for an ethnic Mass that uses guitars and drums in that historic and beautiful building.23
At St. Thomas, the procedures involved adding close-in sound-reflectors to raise early sound and reduce reverberant sound. In one case, a complete Wenger concert “shell” was used with overhead and side-wall sound-reflecting surfaces. In another, a wall behind the performers closed off the chancel.
VI. Echo Considerations
The work by Bolt and Doak, based on work by Helmut Haas, suggests that if no useful reflected or loudspeaker signals are received zero to 38-50 milliseconds after the direct signal, a strong signal more than 38 ms late (that in the 0 – 38 time span would be useful for intelligibility) may be heard as an echo. So “The Initial Time-Delay Gap,” T1, is important for music and speech acoustics,37 However, any T1 less than 38 ms. appears satisfactory. T1 is the time between direct sound and the first significant reflected energy. “ITDG” or “Initial Time Delay Gap.” Are delays evident in any other medium or dimension than time? Beranek switches between T1 and ITDG. We will use T1.
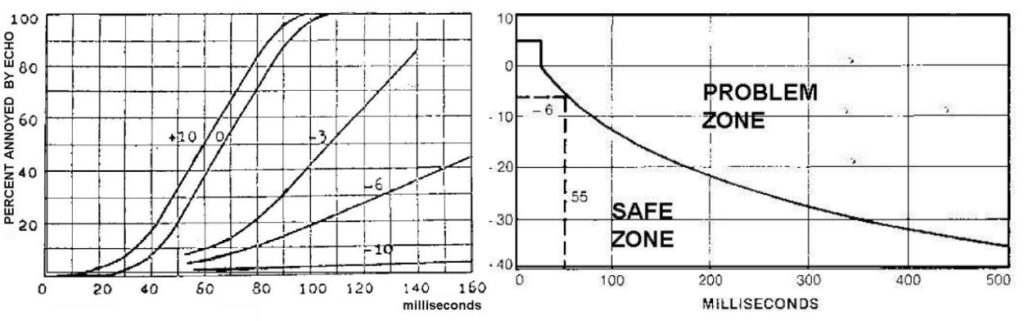
Figure 16. The left graph displays Helmut Haas prediction of echoes, with the numbers in the graph indicating the relative strength of the reflection to the initial signal. The right graph displays the suggested criteria by Bolt and Doak for speech reinforcement room design. The left-axis again shows the relative strength of the first reflection to the initial signal.37
VII. CONCERT HALL DATA FROM THE BERANEK BOOKS
The books wherein the halls are discussed are referenced as follows: “1962” refers to Music Acoustics and Architecture, Wiley, New York, 1962;17 “1996” refers to Concert Halls and Opera Houses, How They Sound, Acoustical Society of America, Mellville, NY, 1996;16 “2003” refers to Concert Halls and Opera Houses, Music. Acoustics and Architecture, Acoustical Society of America, 2003, Melville, NY.15 The three classic halls recognized as outstanding, Vienna’s Grosser Musikvereinsaal, Amsterdam’s Concertgebouw, and Boston’s Symphony Hall, appeared in all three books, as did certain of the other halls. Others are in two of the books or only in one. For simplification, only data for occupied halls is shown, and when this is calculated from unoccupied data, the data is shown in italics. In certain cases disagreement exists between data taken at various times, both within one book and between the books. In such cases, this author has made the decision as to which data to use, based on knowledge of the measurement circumstances. Where data is available before and after drastic renovation, both before and after data is presented with an indication of the renovation changes. Halls with panel-arrays are noted by their names in italics. Starred halls (*) are in the 20 “excellent” list of the 2003 book. All data is not necessarily from the consultant of record. Opera Houses not regularly used for orchestral concerts are omitted. In certain cases, the applicable data is not shown in the three books’ tables, but only in the text describing the halls. This applies in certain cases where opera houses are regularly used as concert halls, with changes in acoustics resulting from the demountable stage enclosure replacing typical stage scenery, or the hall lacks a detailed post-remodeling measurement program.
More information, detailed descriptions, and data can be obtained by consulting the three books. Not all measured data is included in this paper; limited to what appears important and/or independently variable. The usefulness of the various measurements is discussed in detail in the three books, and the author takes exception only to Beranek’s discussion of Clarity C80 and the Initial Time Gap, T1, as mentioned earlier, with references, and discussed further on. Numbers are assigned to halls where sufficient data permits inclusion in Figure 21. The order of data presentation is intended to allow easy reference to data and figures in the 2003 Beranek book. The data from all three books combine to show the remodeling changes.
Seats Audience seating capacity, number of audience seats. Below, seating area as defined by Beranek, with the area in square meters including the orchestra on the stage.
Vol = volume in Cubic Meters. The number below is the volume divided by the effective total seating area as defined above, Beranek gives the reason for including the orchestra. Below is a number in meters, volume divided by effective (Beranek’s definition) audience plus orchestra seating area.
T1 Initial time gap, milliseconds between direct sound and the useful first reflection
RT Mid-frequency reverberation time, average of 500 and 1000 Hz (octave-bands). Time in seconds for decay of 60 deciBels after the sound source ceases abruptly. (I strongly object to the new standard of measuring only 30 deciBels of decay, as discussed further in this paper.)
RT125 Same, but for 125 Hz octave band.
C80 Clarity for music, decibel ratio of early-to-reverberant energy with 80 ms. being the dividing time. Here, averages of the 500, 1000, and 2000 octave-bands.
EDT Early Decay Time, same as reverberation time, but only the first 10 deciBels and multiplied by six.
EDT125 Same, but for 125 Hz octave band.
BQI Binaural Quality Index, 1 – IACC, where the latter is the decibel difference in Sound Pressure Level between the two ears, 0 – 80 milliseconds, in the 500, 1000, and 2000 Hz bands. Here only, unoccupied data is used because occupied data is unavailable, and Beranek concludes that where both sets of data are available, there is little difference.
Acoustical Statistics of Selected Concert Halls & Opera Houses
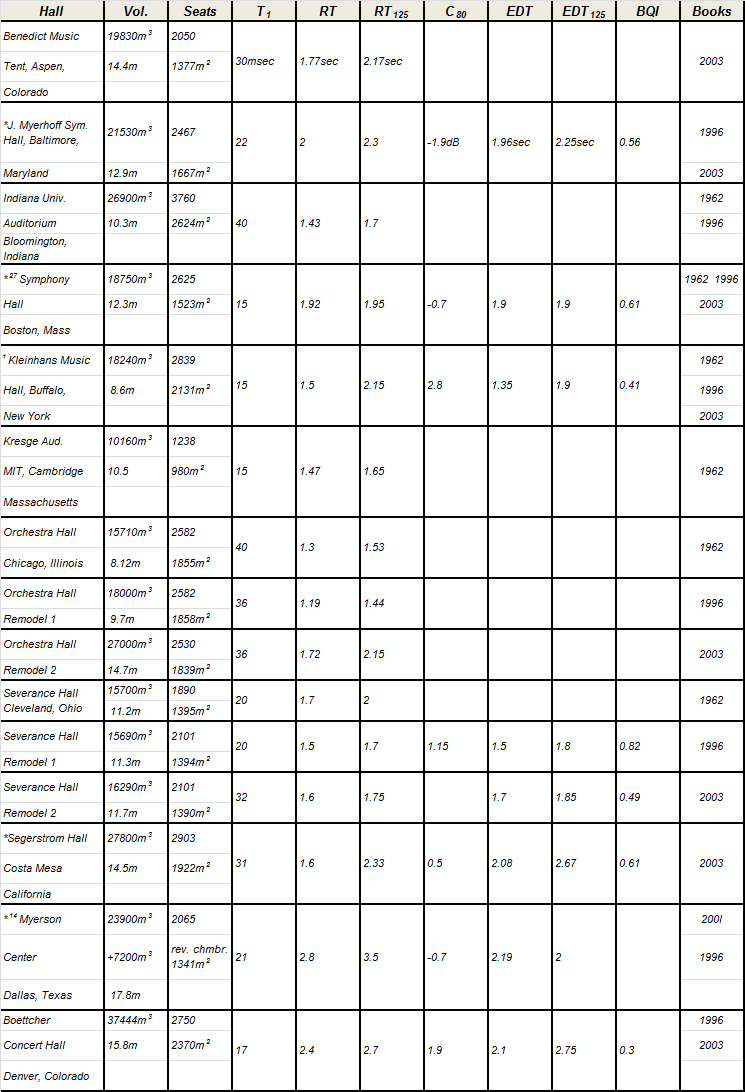
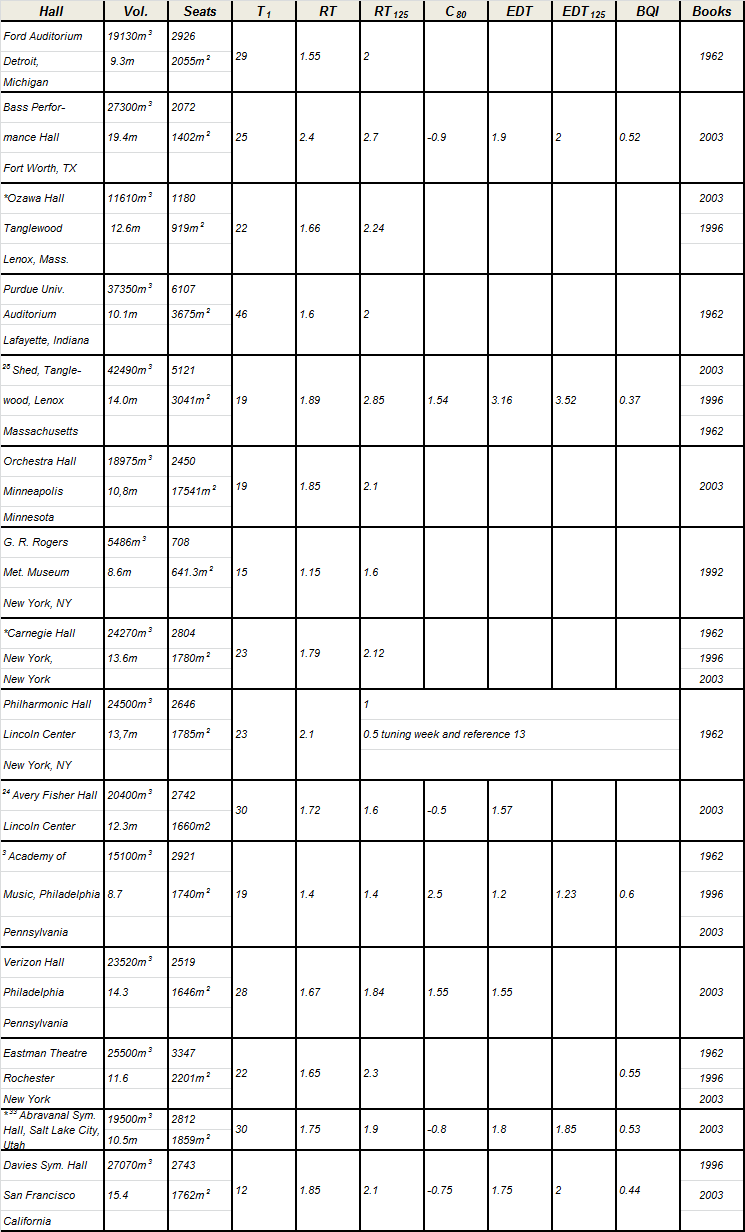
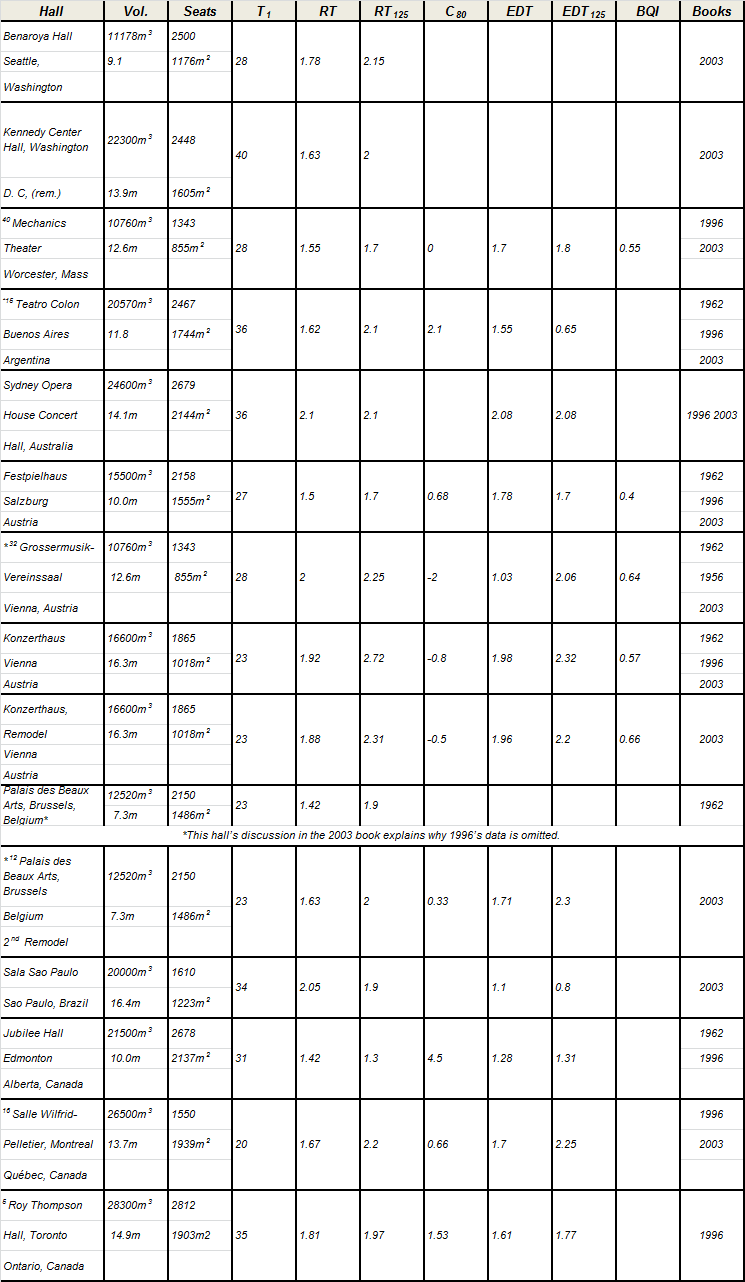
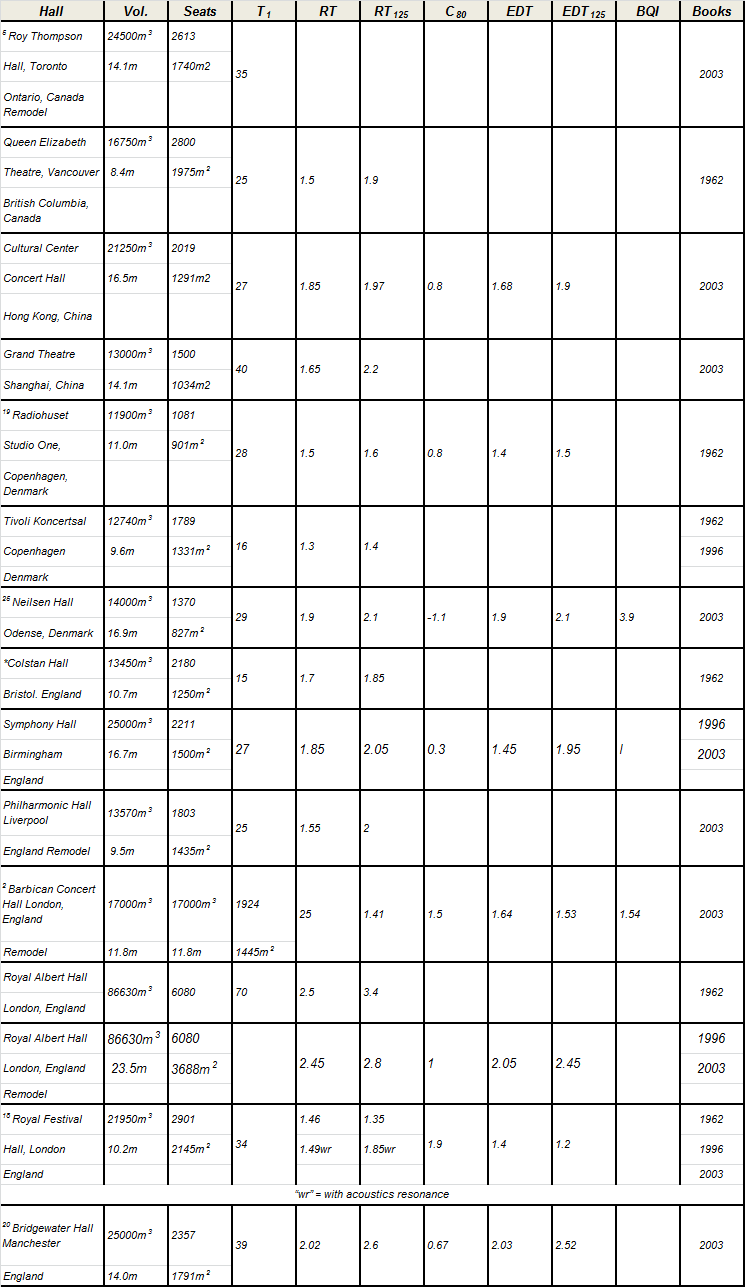
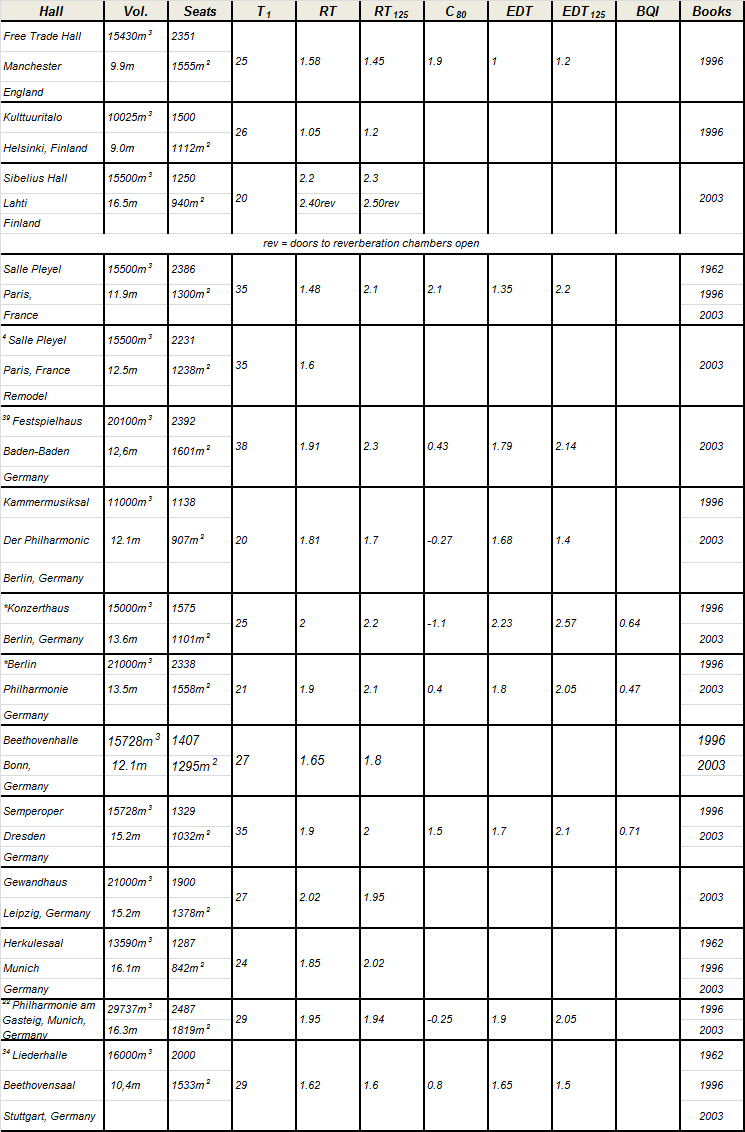
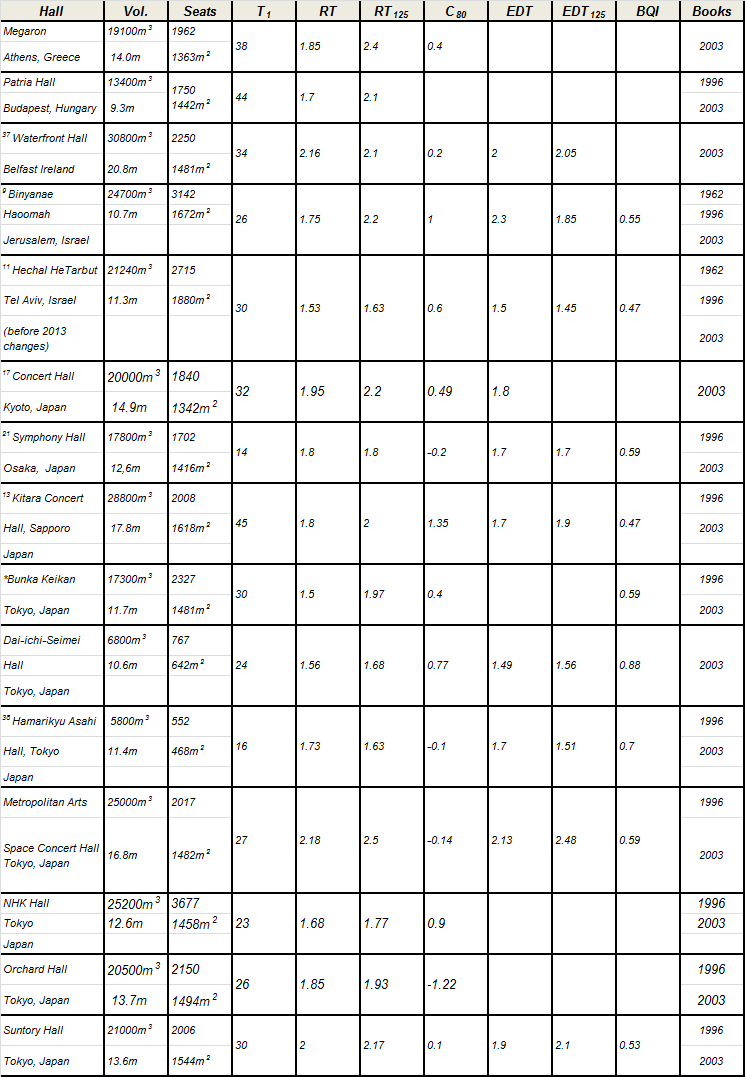
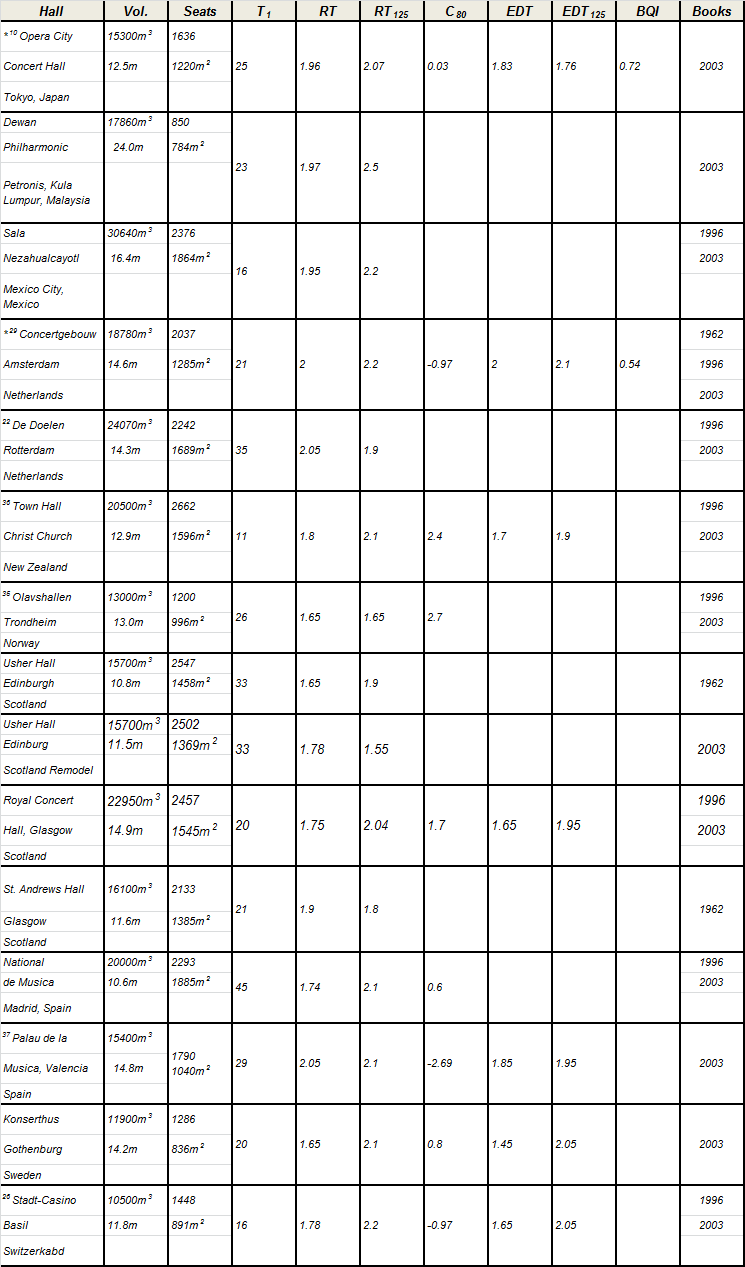
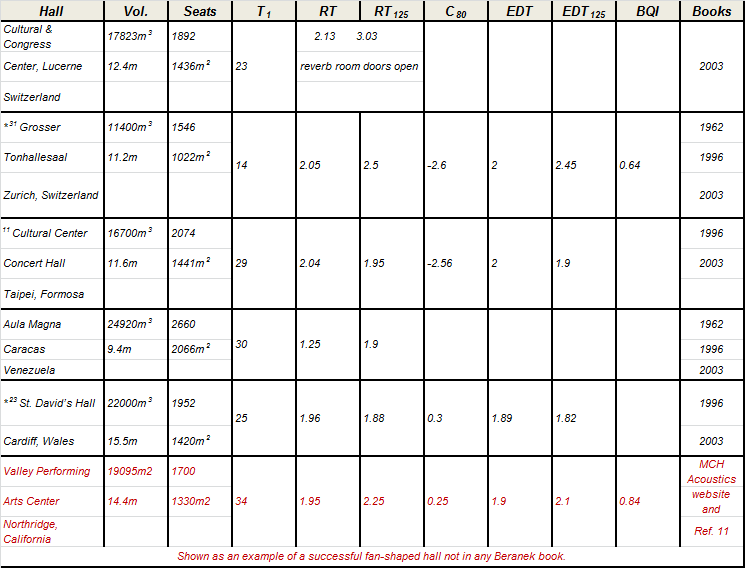
Figure 17 plots clarity vs. reverberation time for halls where data is available, showing a high degree of independence for clarity with reverberation time.
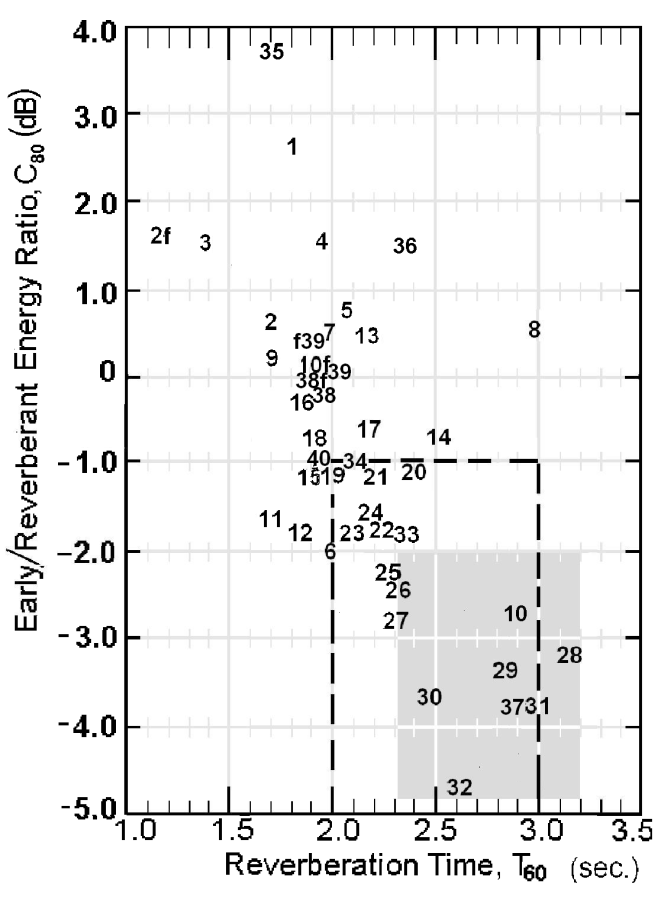
Figure 17. Music Clarity, C80, plotted vs. reverberation time for concert halls where appropriate and complete date is available. All data in this figure is empty data except where “f” is indicated for full, and the empty data is also show repeating the number without the “f.” In some cases the same number is used for two halls because the data is the same or very very close. The shaded area shows the data defined by Beranek in the 2003 books as insuring excellence for classic halls with thin seat upholstery, while the dashed lines enclose the area the author derived from the Beranek area for halls with usual contemporary seating. The purpose of this figure is to demonstrate the independence of Clarity, C80, with respect to reverberation time.
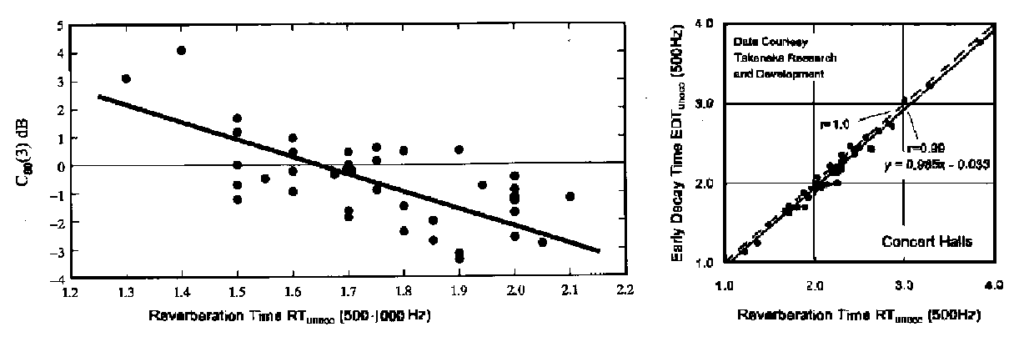
Figure 18. With respect to Reverberation Time, RT, Figure 12.2, p. 482, Ref. 7, the 1996 book, at left, shows C80 has far more independence than EDT, as shown in Figure 4.3, p. 567, Ref. 6, the 2003 book, at right. Proper use of sound-reflecting panels can provide independence for both. In both figures, the frequencies for measurement, 500 and 1000 Hz or 500 Hz alone, refer to octave bands, not single frequencies. Consult the two Beranek books for more details on these measurements.16,15
VIII. OUTSIDE THE SHOEBOX
Valley Performing Arts Center
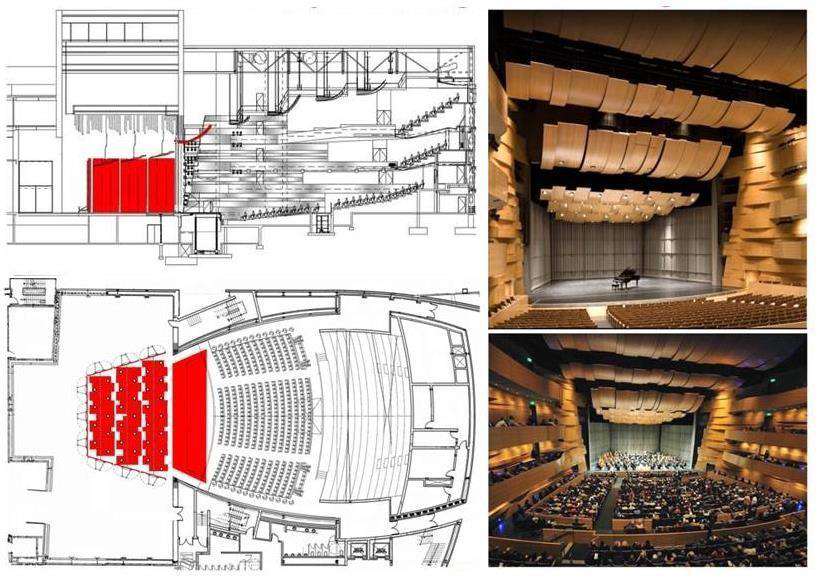
Figure 19. Valley Performing Arts Center, Northridge, California, McKay Conant Hoover, Acoustical Consultants, photos, section, and plan from MCH. Red elements are movable or adjustable.
Figure 19 describes the Valley Performing Arts Center of the California State University at Northbridge, California, for which David Conant, of McKay Conant Hoover, Inc., was acoustical consultant. It has a modified mild fan plan hall, with good sightlines for all seats, with a design intended to provide an acoustical environment close to that of a good shoe-box-shaped hall by use of angled sound-reflecting side-wall surfaces, suspended panels, and a well-designed multi-configuration demountable stage enclosure. Detailed design considerations of this hall can be obtained from the consultants. Figure 20 plots Clarity vs. Reverberation time for this hall, showing a degree of independence for clarity with various configurations of this multi-use hall. The configurations are as follows:
A: Normal theatre use, no stage enclosure, scenery on stage, most adjustable sound-absorption in use, but none that block early sound reflections.
D: Normal opera use, except possibly for pit floor position, scenery on stage, no stage enclosure, no adjustable sound-absorption employed.
E: Normal orchestral use, full stage enclosure, no adjustable sound-absorption employed.
F. Partial-depth stage enclosure behind house curtain, with overhead-side “banner” sound absorption, partial adjustable wall absorption, useful for performing “pop” amplified music groups on forestage. Note that some overhead and side absorbing treatment must be blocking early reflections, through both absorption and moderate sound-transmission-loss, resulting in loss of clarity simultaneous with some reduction in reverberation time.
I: As in “F” above with added “traveler curtain” overhead absorption added, use as above with similar results.
K. As in “I” but with full-depth stage enclosure behind house curtain and double the number of banners exposed, but none that block any major early reflections.
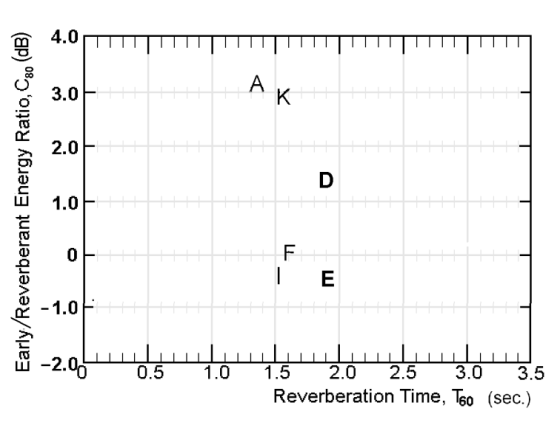
Figure 20. Music Clarity, C80 and fixed mid-frequency occupied Reverberation Time Characteristic, Valley Performing Arts Center for conditions noted in the text, from the consultants data.
Bold-faced data in “D” and “E,” show a two deciBel change in the C80, with only a negligible change in reverberation time. Based on measurements in other halls, as reported in the first reference, we would expect a one deciBel shift to a higher ratio, a less negative ratio, in both conditions, and a 0.2 second drop in mid-frequency reverberation time in both conditions, with the differences between them retained, when the hall is occupied. The other data demonstrates that in special cases, it is possible to decrease C80 while decreasing reverberation time.
Virgil Fox brought his massive touring electronic organ to the Neiderlander Organization’s Pine Knob Performing Arts Center, in Michigan, similar in design to the revised Tanglewood Music Shed. He asked: “Is there anything we can do to reduce the ‘sharpness’ of my sound and increase ‘echo’?” (These were his terms. He meant subjective clarity and reverberation, of course.) No possible adjustments were then available, but they are at the Valley Performing Arts Center.
Segerstrom Hall, Costa Mesa, California
This multi-purpose hall is fan-shaped except for an intruding wedge separating the rear seating into two segments. The wedge’s walls have angled panels supplementing those on the side walls themselves to provide more early reflections to the rear potion of the audience. This hall is more thoroughly analyzed in the 1996 book than in the 2003 book, but does rank 14th in Beranek’s list of excellence in the 2003 book. But, interestingly, a shoe-box shaped hall opened in this complex in 2006, and some concerts have been transferred to this hall. It also uses sound-reflecting panels.
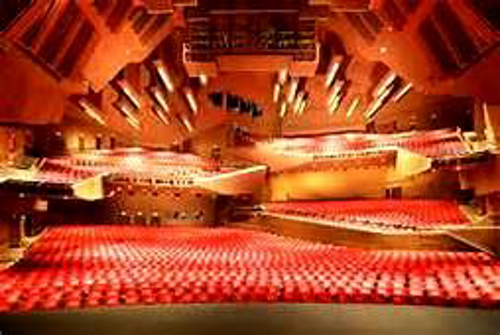
Figure 21. Audience area of the 1996 Segerstrom Hall
Despite its relatively high ranking, this 1996 hall may have a problem that the newer shoe-box hall lacks. In an attempt to provide enough lateral early reflections, at some but not all frequencies specular reflections may be higher by ten deciBels than the direct sound in some seats and so distort localization. A friend reports: “… in 1987, along with a few ex-pat BBNers from the LA office, took in a concert there, featuring, I believe, Janos Starker in a cello concerto. The music was fine, but that hall sounded just weird (my opinion). There were home-brewed QRDs on upper, sloped surfaces near the proscenium – and for the life of me, it sounded like Janos was a one moment emanating from his visually obvious solo position downstage, then would float (as in an acoustical apparition only) float upward toward one of the QRDs – then back down to where he actually was, depending on the register he was playing in (low-mid-high frequencies).” The observation was made 30 years ago. Possibly the problem has been solved, Adjustability is one way of assuring such problems can be solved quickly and with minimum expense; but QRD diffusers are generally used more for echo control than to insure early reflections.
Colstan Hall, Bristol. England
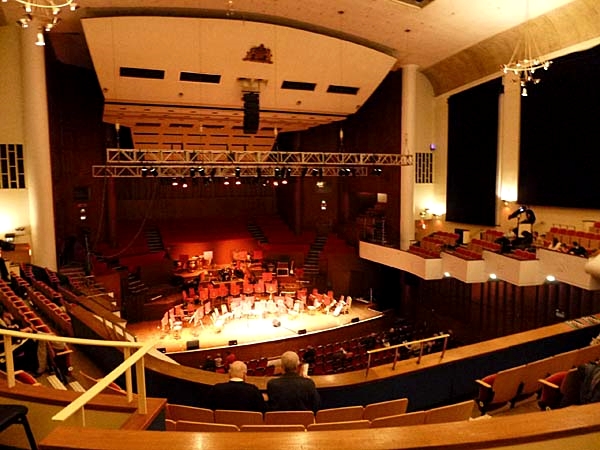
Figure 22. Colstan Hall
This hall, twelfth in the Beranek 2003 excellence list, is described only in the 1962 book. It is basically rectangular in the front half, and a mild fan-plan to the rear. A renovation and renaming is about to start as I write. The renovation is a renewal of a much-beloved hall and not in any way a criticism of its existing acoustics.
St. David’s Hall, Cardiff, Wales
The architect and acoustician of this hall faced some real site-restriction height and plot design challengers. The result should prove once and for all that a successful concert hall can be outside the shoe-box concept. It is tenth on Beranek’s list of excellence. The criticism that the vertical surfaces planned to provide close-in reflections to simulate those of a rectangular hall fail to do the job (unlike other halls with seating surrounding the stage), because they are aligned with sight-lines, is not valid in my opinion. (1) Most musicians are not directly on the hall’s center-line. (2) There are surfaces not aligned with the sight-lines.
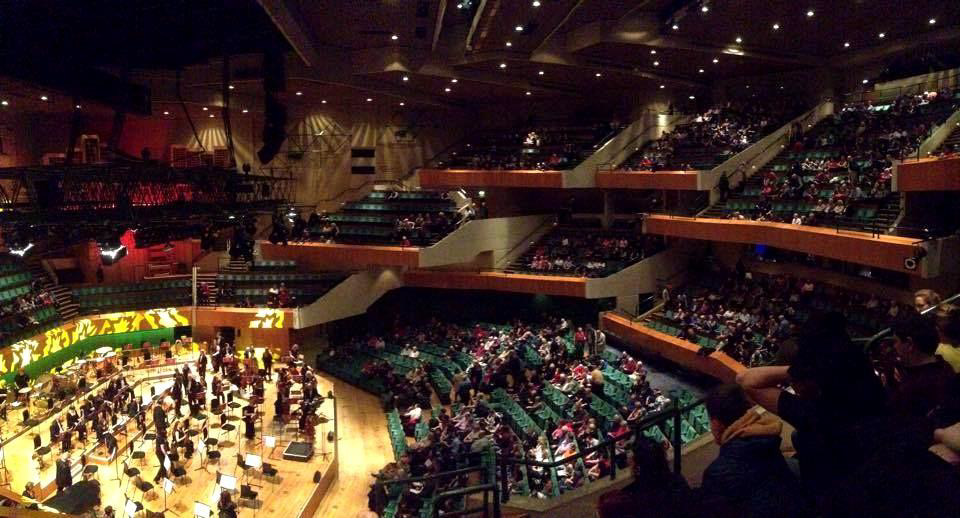
Figure 23. St. David’s Hall, Cardiff, Wales. Sandy Brown Acoustics
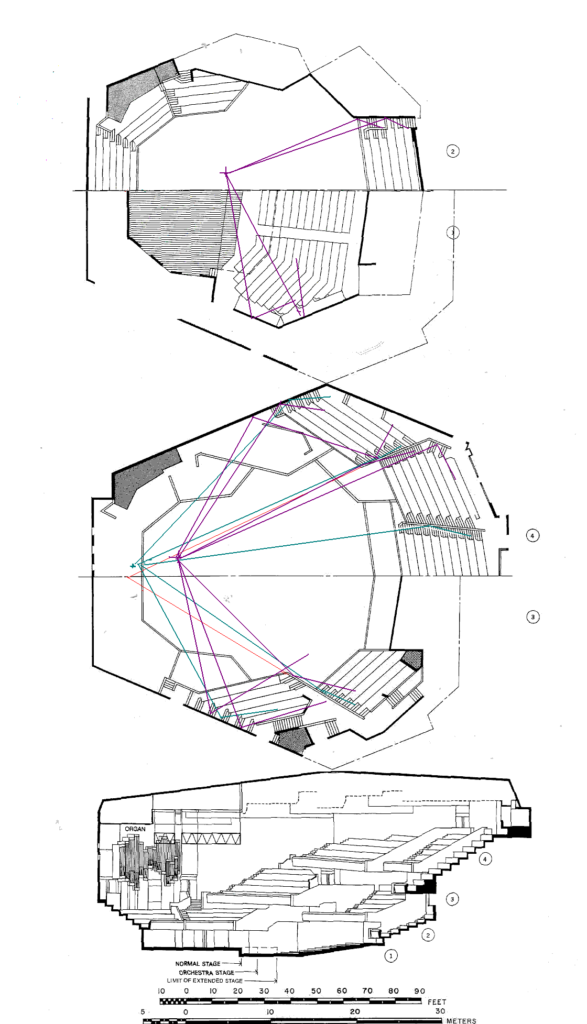
Figure 24. St, Davids Hall, Cardiff, Wales, with colored lines ray-diagraming of possible lateral reflections. Thin red lines show that from one location, focal point of line-of-sight barrier alignment, indeed no lateral reflections are possible. But elsewhere they are possible.
XI. EDT and C80 problems and possible solutions
Assume a hall that is used as a concert hall on occasion, but lacks sound-reflecting surfaces for early reflections. Other characteristics are appropriate, T60 of 2.4s at 125 Hz, 2.0s at 0.5k, 1.0k and 2.0k, 1.7s at 4.0k, with freedom from echo through diffusion. But no strong early reflections, the early reflections are from musicians’ furniture and the walls surrounding the stage are well masked by the performers and furniture and begin at 10db below the direct sound. Here, the EDT is very low, possibly 0.12s through the frequency range, time to the 10dB drop in level from the direct sound to the first reflection! Clearly EDT gives a poor correlation with the subjective acoustics in such a space. And then when we bring in side and overhead reflectors to provide significant early reflections, as well as envelopment, the EDT lengthens as subjective music intelligibility and clarity increase. Such acoustical conditions were demonstrated first without and then with the speech reinforcement system of the First Baptist Church of Chattanooga, as measured by J. Jacek Figwer.32 C80 would give an accurate picture of the original conditions and of the improvement for music in such a case (and C50 for speech). This seems a special case however, and the energy-time displays for Boston’s Holy Cross Cathedral, and New York’s St. Thomas Church, (Figures 12 and 13) ,with similar reverberant conditions and delayed sound systems for intelligibility, suggest that EDT and C80 should be better correlated in these two large churches.
A similar (or reverse) problem exists with C80, also in rare cases. At the rear of a flat-floor or near-flat-floor hall the direct sound may be very attenuated, and the energy from the first reflection more than 10 dB higher than the direct sound energy. Most often this situation exists in deep under-balcony spaces, and the difference in time of arrival of the direct and the first-reflected sound energy is minute, negating the problem. But in high-ceilinged spaces the time difference may be as high as 15 or 20 ms. My practice, after consultation with Ted Schultz and Ronald McKay among others, was to discard the initial sound and set the curser for early-to-reverberant analysis on the time of arrival of the first strong reflection, the direct sound being too weak to be of importance.
IX. Data Correlated with Preference Data, with and without sound-reflecting panels
Bolt Beranek and Newman first used sound-reflecting suspended panels to cure predicted focusing effects of the domed ceiling of the Aula Magna in Caracas, Venezuela. The concept was later employed for Kresge Auditorium at MIT, Cambridge, Massachusetts, for the same reason. In both cases, the early reflected energy and greater clarity were appreciated by-products, but the theory of their application for this purpose and measurement techniques for evaluation were in the future. See pages 479-484 of Reference 15.
The first Bolt Beranek and Newman project that employed suspended sound-reflecting panels for specifically musical purposes was the 1959-1960 renovation of the 5000-seat “Music Shed” at Tanglewood, Lenox, Massachusetts, the summer home of the Boston Symphony. Here, the panels were intended to improve sound distribution and balance throughout the audience, improve clarity, and improve on-stage communication. They accomplished all these goals. Pages 93-38, Reference 15. The array of panels was planned about 50% open to the clear-space above, in part to provide the conductor and other musicians with some sound energy from the organ located above. The hall’s approximately two-second mid-frequency reverberation time (full occupancy) as a positive factor in the Shed’s acoustics was not understood by one of the improvement program’s designers, and the original sketches showed the semi-circular rear wall open so the main ceiling could provide reflected sound to the lawn audience behind. The matter was brought up at a conference at Symphony Hall, and the Symphony’s manager, Tod Perry, stated that reverberation time should be retained. The then-existing rear-wall configuration, with sloped panels to control echo installed at the recommendations of Professor Fay of MIT before WWII, was retained for the 1959 Summer Season. Ron McKay designed new sloped panels with both greater sound-diffusion and better appearance, and these were installed before the 1960 season. Eventually, Tom Horrall at BBN designed an excellent electronic sound-reinforcement system for the lawn listeners, supplementing without conflict (by use of digital delay) the live sound energy received through the open lower half of the rear wall.
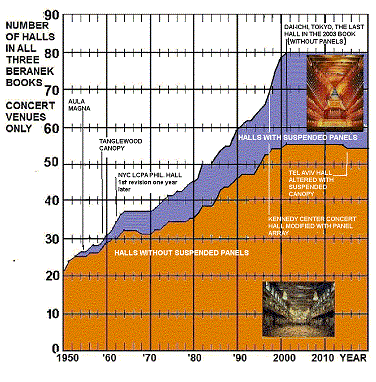
Fig. 25. Quantity by year of halls included in the three Beranek books with and without overhead sound-reflecting panels
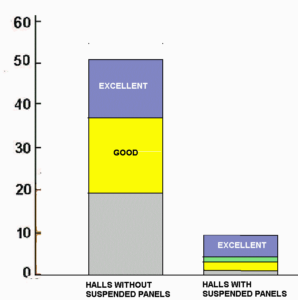
Fig. 26. Halls with and without overhead panels rated by excellence from Beranek interviews. The single hall in green is the Tanglewood Shed. I would rate it as excellent, and so do all the musically informed people Beranek interviewed, I was a regular subscriber to the Boston Symphony at Symphony Hall, 1958-1967, and attended concerts at Tanglewood at least three times each summer during that period. Beranek said that the two reasons he de-rated the hall were (1) its fan-shape and size, and (2) less than optimum loudness because of the size. I would discount the first reason, and counter the second with the explanation that being in a country environment, with less background noise to live with than in the typical city environment of a typical concert hall, less loudness can be tolerated while retaining a sense of the beauty of the orchestral sound.
Only a fraction of the halls for which data is presented were subject to Dr. Beranek’s thorough musician and critic evaluation process, and only those halls are shown in Figure 2, from page 496, Reference 15. In all cases, the opinions are those of the critics and musicians interviewed.
Figure 27 traces the history of Philharmonic Hall from its first season through its 1976 reconfiguration as Avery Fischer Hall. For more detailed reasons for its failure in the first season to please critics and musicians, References 38 and 39 should be consulted. A summary is that the stepped nature of the panel array produced phase cancellation in the fundamental cello frequency region, the same frequency region that is most attenuated in sound passing over flat-floor or nearly flat-floor seating; and the addition of a second layer of sound reflecting panels over the initial layer, due to false judgement neglecting unanticipated acoustical changes between tuning week and the completed building, reduced drastically the amount of reverberant energy reaching most listeners’ ears. The reverberation time was close to predictions, but Clarity was too high.38, 39
BBN’s recommendations addressed both problems and others, but a different group of consultants, based on the success of the Seattle Opera House,40 produced the design that existed for the hall’s second season. This used the panels to form one continuous panel from the stage to the rear, with reverberant sound reaching listeners only by reflections at the edges of the hall and at the rear. The alignment eliminated the first problem, but increased the second, the hall being judged good but far too “dry” or non-reverberant. In retrospect, this could have worked well if overall 50%-opening large holes had been provided, by omitting some panels, or the canopy had been reduced in width and cut back to about two-thirds its length. The third year saw an attempt to solve the problems by eliminating the panels completely and installing a stepped ceiling, with care that the interference produced by the steps in the ceiling was not at the same frequency range as incurred by sound passing over seats. This renovation followed a conventional auditorium design, reducing volume and reverberation, while assuring even sound distribution.
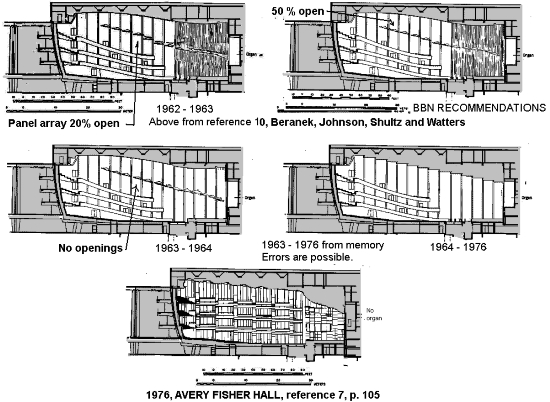
Figure 27. Philharmonic Hall – Avery Fisher Hall History
The third configuration lasted for ten-plus years, until the acoustical consultant Cyril Harris and architect Philip Johnson were hired to produce Avery Fisher Hall, close in design to the successful Abravanal Hall in Salt Lake City and the later Benaroya Hall in Seattle, all being about as close as possible to the basic architectural design of Boston’s Symphony Hall, Amsterdam’s Concertgebouw, and Vienna’s Grosser Musikvereinsaal. The problem is that the design of these three halls is not directly expandable to larger seating areas without some acoustical compromise in one characteristic or another (compare the data; the compromise in this case being reverberation time, from volume-to-seating area ratio), leading to a further revision, in design concurrent with my writing.
Was the Lincoln Center management wrong is not allowing BBN the privilege of modifying the somewhat compromised design that existed the first season? (For the compromises, read References 39) Or possibly have given the designers of the second-season installation the opportunity to modify it on the basis of new data? To me, personally, the answer is in the Ozawa concert hall at Tanglewood. Basically, this is a recreation of the Grosser Musikvereinsaal of Vienna, only slightly larger in volume, seat-count, and seating area, not as large as Symphony Hall, Boston, or the Amsterdam Concertgebouw.15 Yet, it has sound-reflecting panels. Unlike the Tanglewood Shed and Boston’s Symphony Hall, its use is not by primarily trained, mature musicians, but for concerts performed by the Tanglewood student orchestra and recitals by individual students among them. It is in the excellent rating by Beranek, and the 13th of the 20 in the list. Are there Boston Symphony musicians that will commit themselves to say that performing on the stage of Ozawa Hall is even easier than on Symphony Hall? The 5th in the list, the Tokyo Opera City Concert Hall, is also a hall with suspended sound-reflecting panels. Eight out of the excellent list’s twenty halls are panel-array halls, a majority of the list’s excellent halls constructed in the post-WWII period. Again, the list was prepared by evaluating interviews of musicians and critics.
The three books, particularly the 1996 and 2003 books, have many examples of successful panel-array designs, the earliest intended for music-acoustics being that at the Tanglewood Music Shed. In most concert halls, the array can be restricted to the stage and the front one-third of the audience area, and should be about 50%-open.
X CONCERT HALL OPTIMIZATION
Returning to Figure 17, the data located in the shaded area are only for halls that are the highest on Beranek’s ratings with thin upholstery, pages 495 and 496 of the fifteenth reference, or halls not included in the rating system because they are new or because of unusual characteristics that place them outside the category of enclosed concert halls. However, these halls have also received only acclamation. While taking note that the data is for unoccupied halls, there clearly is an optimum range for C80, – 3dB to zero decibels. A dashed line extends the range to halls with seats with heavy upholstery. The data for the halls in Figure 17 where data is available both occupied and empty, suggests –5dB to –2dB for empty halls with thin-upholstered means and –4dB to –1dB for empty halls with well-upholstered chairs. This generally agrees with Beranek’s recommendations for analyzing data, Table 4.3, p. 536 of the fifteenth reference.
Figure 28 represents an idealized concert hall with measures allowing the performer to adjust C80 to his or her satisfaction by a motorized overhead canopy and portable stand-alone reflectors. A wide range of C80 values should be possible in such a configuration without changing reverberation time appreciably. In “a” the violinist wants maximum clarity (+2dB) for a Kreisler’s Recitative and Scherzo-Caprice, somewhat less (+0.5dB) in “b” for Bach chaconne, a greater tilt to reverberation (-2dB) in “c” for the violin solo of “Ave Maria,” and then she shows her skill as an organist in “d” in a Messiaen, late work maximizing a sense of “mystery.” (-4dB). As organ soloist, the musician has her back to the audience, so they can see her feet on the pedal-board and hands on the keyboards, rather than just her face above the large organ console.
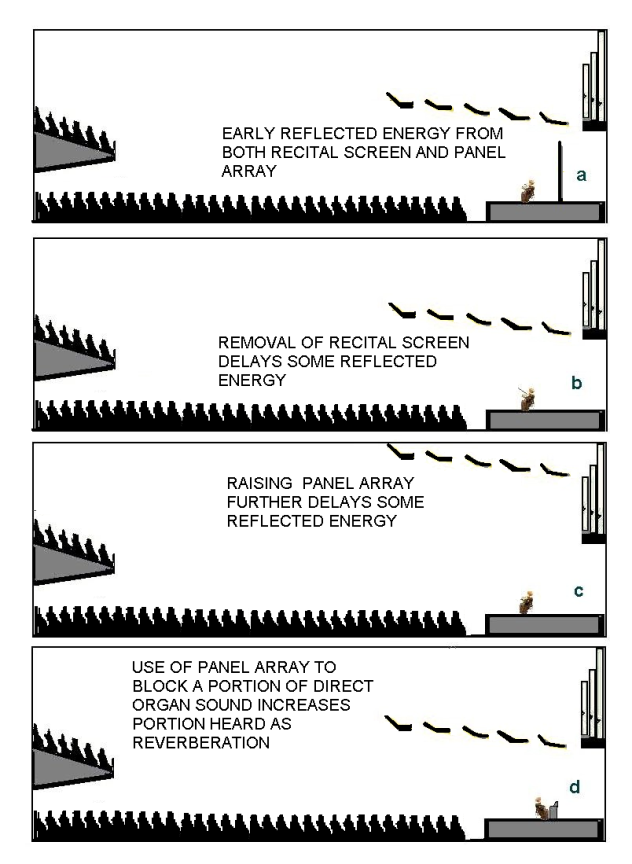
Figure 28. Varying Clarity, C80 with a fixed Reverberation Time in a proposed concert hall. Top maximizing clarity for a violin solos recital with fast-running musical passages, second a bit less clarity and more apparent reverberation for more dreamy and romantic music, process continued for the third arrangement, and a move to an organ performance emphasizing “mystery,” with reverberant sound energy predominating.
Halls that have specific measures to change Clarity, as well as independently changing reverberation time, include:
Buffalo-Amherst, Slee Chamber Hall, where the entire stage ceiling can be tilted at different angles.
Dallas, McDermott/Myerson, where the stage ceiling – front-of-hall reflector, can be adjusted for varying heights.
Washington, DC, Kennedy Concert Hall, where overhead reflectors can be adjusted for varying heights and angles.
St. Paul, Ordway Hall, where panels above a sound transparent ceiling can be adjusted for varying angles and heights.
Hopefully, the adjustable features of these halls and other halls can be used to provide additional data in the future. Data can then be shown for these halls as for the Valley Performing Arts Center in Figure 20.
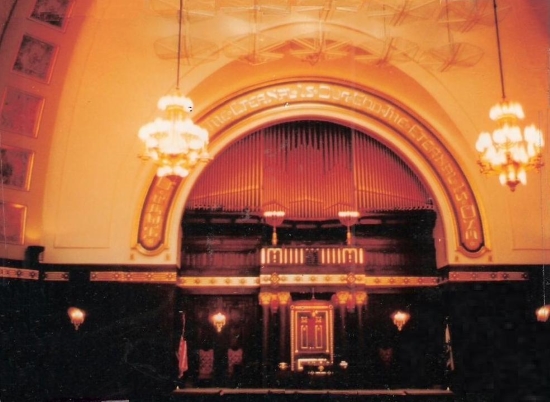
Figure 29. Congregation Rodeph Shalom, Pittsburgh, Pennsylvania. Here, the panels remove the problem created by a focusing domed ceiling. A Klepper Marshall King project, with Ehrenkrantz, Eckstut and Whitelaw, Architects.
If fixed or moved as a group, the panels should lie in a single tilted plane or the height differences between them should be randomized. Surfaces that provide a degree of diffusion may be better than plane flat surfaces. However, Figure 5 shows a 1962 design using flat-plane panels in a randomized configuration, both horizontally and vertically. Figure 29 shows light-transparent panels, all in one tilted plane, but with panel surfaces providing some sound-diffusion in addition to that provided by edge-scattering.
Hall Size: Of the three top-rated halls, the Concertgebouw is the largest in volume, 18780m3, but only slightly larger than Symphony Hall, which is the largest of the three in seat-count, 2625, and seating area 1523m2. The Tanglewood Music Shed approximately doubles these figures, but Beranek regards this as a special case, and perhaps we should, also. It is replicated, again in very quiet rural surroundings, by the Saratoga Performing Arts Center, summer home of the Philadelphia Orchestra. I have no measurement data on this hall, but my two orchestra concert listening experiences showed it to be comparable to Tanglewood, excellent in every way. (The first time I heard Samuel Barber’s beautiful “Nashville, Summer of 1915.”) The Saratoga hall uses one great suspended sound reflector, much like the Dallas concert hall that is No. 11 with 2065 seats, and in both these cases, one can simply wonder if there are disguised acoustical holes in the overall reflector or if all the reverberant energy is returned from the sides and rear. With L. Gerald Marshall and Larry S. King, I may have helped to provide another approximation at the summer home of the Rochester Philharmonic at the Canandaigua Performing Arts Center, Canandaigua, New York.
As noted earlier, Costa Mesa, California’s Segerstrom Hall, with 27800m3 and 2903 audience seats for a total seating area of 1932m2, is largest hall in Beranek’s list of twenty excellent halls, and it is 14th. An unusual panel array system is in use; the hall is not a typical design but is an asymmetrical fan-plan hall.
A designer wishing to achieve an excellent concert hall with a size larger than 2500 seats with modern seating would do well to count on the use of suspended sound-reflecting panels below a sound-reflecting ceiling. If they are adjustable, in height and/or tilt, then fine-tuning and adaptability for different needs of different musical groups will be possible.
Volume/Seating Area and mid-frequency reverberation time: The volume/seating-area ratio is critical to obtaining adequate reverberation time. For the top three, the range is 12.3 meters, Boston, to 14.6, Amsterdam. For all twenty, the range is 7.3 for the renovated Brussels Palais des Beaux-Arts, 19th of the twenty, to 17.8 for the Dallas, Texas, Meyerson Concert Hall, eleventh in the list. Within the twenty, the Dallas hall has the highest Reverberation Time, with 2.80 seconds, but easily adjustable. Tokyo’s Bunka Kaikan at 1.50 seconds is the lowest reverberation time, but possibly the orchestral stage enclosure was not in place for this measurement and it includes absorption by stage scenery. For the list’s first three, the range is only 1.92, Boston, to 2.00, both Vienna and Amsterdam. Half of the excellent halls are in the 1.80 – 2.05 seconds range, including all in the top seven, except for Buenos Aries’ Theatre Colon, and again the stage enclosure may have been missing, and the stage scenery absorption included.
In the past, reverberation time was usually measured using chart recorders with visual display of the decay of sound, and protractors calibrated for use with the particular chart recorders would be applied to read the reverberation time. Today, signal processing devices receiving sound from specialized sound sources give direct readings. A new standard defines T30 with a value multiplied by two for only the first thirty deciBels of decay instead of the 60 required for a normal measurement. For popular music and speech, there should be no difficulty in using this standard, making the measurement less sensitive to background noise data distortion. However, some music does use the entire decay of a fortissimo sound for musical effect (Bach’s Toccata and Fugue in D minor, for organ or as orchestrated, one good example), and I would prefer to be able to examine the entire 60 deciBels of decay, preferably using the classic visual method. Beranek’s recommended minimum occupied RT of 1.8 seconds15 seems appropriate for me, but I would suggest his maximum of 2.1 could be raised to at least 2.3 seconds raised if a C80 of -1.0 – -0.5, occupied, can be attained.
Reverberation time at 125Hz octave-band/vs. mid-frequency reverberation time: In all three books, Beranek agrees with others that a rising reverberation time characteristic, along with the a rise in quality of energy efficiency (subjectively simple loudness, and defined as “G” in the Beranek books), toward low frequencies is advisable. Nearly all the calls rated excellent have this characteristic. The single exception is St. David’s Hall, Cardiff, Wales, 10th on the list of excellence, which has a slightly lower reverberation time at 125 Hz, 1.88 seconds, then the average mid-band at 1.92 seconds. Should we question the accuracy of the measurements or find some other reason? But notice also that the bass rise for Symphony Hall, Boston is less than a tenth of a second. I still have similar questions concerning the acoustics of Holy Cross Cathedral, which has a fine reputation for the acoustics for choir, organ, congregational singing, yet also has a lower reverberation time at low frequencies than at mid-band, 2.2 seconds versus 2.9 seconds, fully occupied, as shown in Figure 1.23 My listening experience would tend to suggest that lower reverberation times at low-frequencies are most problematical in relatively non-reverberant (“dry”) halls. This hypothesis is suggested by the fact that none of the excellent halls have a 125-Hz-band reverberation time less than the 1.85 seconds of the Bristol hall. Boston with 1.95 seconds is the lowest of the top three, 2.25 for the Vienna Hall is the highest, with the Amsterdam hall at 2.21 almost as high. Among all the 20 halls rated excellent, the Dallas hall has the highest, far higher than others, at 3.5 seconds, controllable with doors closing on reverberation chambers. For a new hall, notwithstanding the Boston Cathedral experience, I would suggest a 125 Hz RT at least 10% higher than the mid-band value.
Clarity, C80, the ratio of early to late energy 500-2000 Hz, with 80 milliseconds the divider: C80 for the top three ranges from -2.0 dB for the Vienna Grosser Musikvereinsaall to -0.7 for Symphony Hall, Boston, with the Amsterdam Concertgebouw at -0.97. Possibly either the measurement or my calculation to derive the occupancy value from unoccupied data for the Vienna hall is in error, or both. (Subjectively, I found music clarity in the Vienna hall greater than in Amsterdam and similar to Boston,) In the entire list of the 20 of excellence, values range from a high of 2.0 dB to a low of -2.6 dB. But this 4.6 dB spread is a fraction of the total spread in all halls measured; the total range being 4.5 to -2.6dB. My suggestion is to aim for a C80 of -1.0 to -0.5 deciBels for the occupied hall, meaning an empty hall value of -2.0 to -1.5 with normal seating without excessive sound-absorption, but more seat absorption than in the older halls. Unless one copies an existing successful design, scale modeling and/or computer modeling is a necessity to be certain of success in this matter, unless one builds in considerable adjustability (easiest to arrange with adjustable height and tilt of sound-reflecting panels) and schedules acoustical adjustment rehearsals before the hall’s opening.
T1 varies between 15 for Boston, to 21 for Amsterdam, and 28 for Vienna for the top three halls. Very few halls in the entire list exceed 40, and none of these are in the excellent list. Reference 18 suggests that avoidance of violating the Bolt-Doak rule for echo prevention should mean a T1 less than 38 milliseconds,18 but once that criterion is met, the actual value appears to me as not particularly important.1 If a hall without suspended panels is kept reasonable in size and has a suitable shape, or larger halls employ such panels, meeting this requirement should be easy by keeping the path-length distance difference between direct sound and that of the first reflection to less than 13 meters for most audience seats. Especially if chamber music is to be part of programming, 28 milliseconds or less is preferred, with the path difference nine meters or less.
Note that in addition to use of sound-reflecting panels, shaping of surfaces can effect changes in Clarity, C80, while keeping Reverberation Time constant. Tilted balcony fronts, splayed or tilted walls, etc., can be used to either maximize or minimize early reflections. Panels are most useful when adjustable.
Binaural Quality Index: The virtue of being enveloped by sound, rather than having it simply come in the direction of the stage, was long thought to be a desirable quality dependent on reverberation time alone. But in 1968 Keet showed that this Binaural Quality Index was a good measure of how envelopment in sound was perceived by the listener.41 It is not mentioned in the 1962 book. The three classic top halls have values close together, 0.54 for Amsterdam, 0.61 for Boston, and 0.67 for Vienna. The shoe-box plan, with reasonable diffusion on the walls, with either a tent-shaped ceiling or a diffuse flat ceiling, should insure values within this range. Other shapes and larger sizes than the classic halls will require the same kind of attention required by the value of Clarity, C80. And note that the Tanglewood Shed, at 0.37, still gets excellent ratings from educated listeners.
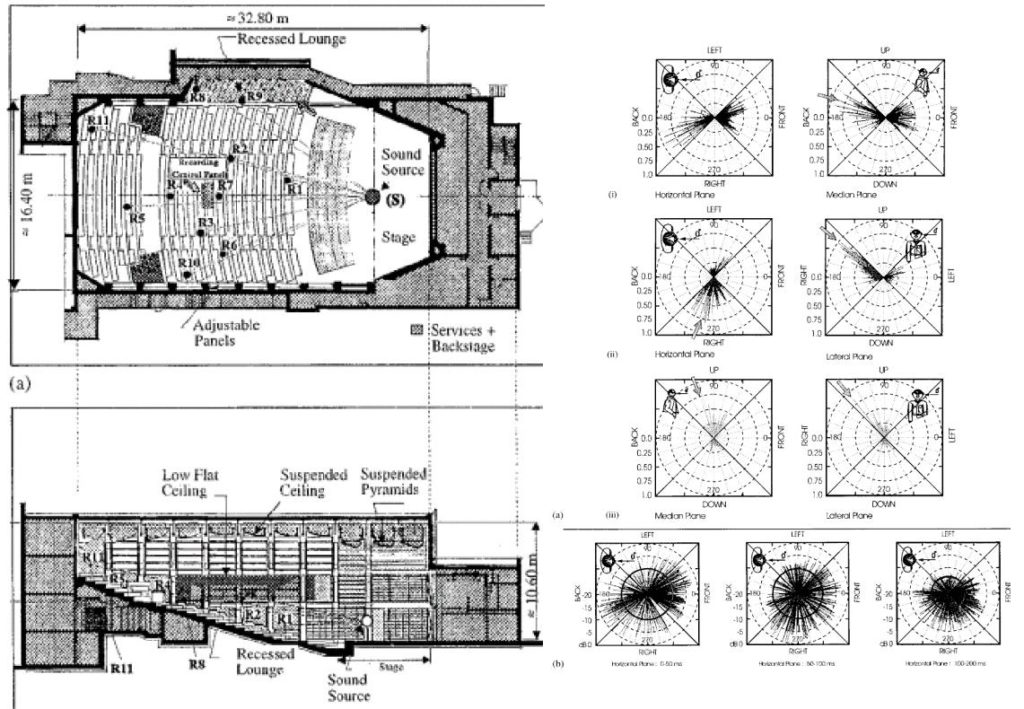
Figure 30. Typical displays of intensity vs. angle at Layola Concert Hall, Concordia University, Montreal, Canada, and plan and section of the concert hall.42
Inspection of the graphic representation of the decay of sound for reverberation measurements are valuable, as are graphic descriptions, “porcupine pictures” of sound energy arriving at the listener, These should show the 360-degree horizontal values and also the 180-degree spread of vertical values, lateral and longitudinal. In the front-to-back vertical presentation, a 90-degree-received lateral reflection will disappear, and in the horizontal presentation a 90 degree-received vertical reflection will disappear. Modern instrumentation and microphone techniques can produce such graphical representation, and it should be possible to include it in computer simulations and instrumentation of scale models, as well as measurement evaluation of existing and new halls.42 Although this reference is geared primarily to solving problems, most of all discreet echoes, in existing halls, it can also provide a guide to quality, differentiating between good and excellent. One might best use the technique for twelve measurements at each measurement location, 63, 125, and 250 octave-bands inclusive, separate from 500, 1,000, and 2,000 octave-bands inclusive, and (for music) 0-80 milliseconds, and 80-2000 milliseconds, the last figure (2000) modified to account for the reverberation time and noise floor, this procedure in horizontal, front-to-back vertical, side-to-side vertical planes.
XI. Pipe Organs
Carnegie Hall is reputed to have refused a gift of an organ, and Cyril Harris asked that an organ not be installed when responsible for the acoustics of Avery Fisher Hall, the 1976 renovation of Philharmonic Hall. Arguments can be made that digital technology has advanced to the point that good organ sound can be had through electronics and loudspeakers, and the expense, space, and the added sound-absorption of pipe organs can avoided. But any layman or musician not technically trained in acoustics can easily determine that sound from typical organ pipes is directional, simply by walking in a circle around an organ pipe in an outdoor environment while a friend excites its sound by blowing, This is best done with flue pipes of principle/diapason or “string” tone, which have more harmonics than organ pipes producing “flute” tone. The experimenter will notice the difference in sound as the pipe is heard from various directions. This suggests that thorough analysis of a single pipe for recording in any medium for later simulation or reproduction in an electronic organ should require many microphones forming a sphere around the pipe. Summing or averaging the signals form these microphones to present a picture of total sound power output is not always as straightforward as may be assumed, but requires careful analysis of how the center of tone production moves at the pipe from the fundamental frequency through the harmonics. It can be done, but lack of a free-space testing environment will raise further complications. Then, of course, totally accurate playback demands a loudspeaker with the same directional characteristics as the pipe. This is an additional complex task, as anyone trying to purchase or build a truly omni-directional loudspeaker array for test purposes, possibly a simpler task, can attest. Then this process must be repeated for each pipe in the original organ. In most cases, the resulting organ would then require more space and be at least as expensive as the pipe organ it is intended to simulate.
In fact, this degree of accuracy has never been attempted by any electronic organ manufacturer. While complete simulation of a pipe organ requires this approach, more normal sound reproduction methods may suffice in many cases to provide an instrument that is close enough to real pipe organ sound to satisfy most people most of the time, including many musicians. Indeed, this writer has recommended specific electronic organs for projects where pipe organs were impractical or would be poorly served by the building’s architecture and acoustics.43 But expectations to exactly reproduce the effect of a real pipe organ will not be met in all music for all performers and listeners without the full scale approach of the previous paragraph.
Philosophical Differences
Pipe organs surviving from Bach’s day, including those he played and/or had his involvement as an advisor, the great organs of Cavaille-Coll known to the composers Frank and Widor, and modern instruments, like the Aeolian-Skinner/Schoestein in the Mormon Tabernacle with pipes from much older instruments, or like the Casavant in the Reorganized Church in Independence Missouri, the Marcusson at Brigham Young University’s Jerusalem Center, and the Fisk at the Lausanne, Switzerland, Cathedral, that are completely new, are truly great works of art. They are icons of Western Civilization as much as the Mona Lisa, the ceiling of the Sistine Chapel, Chartres Cathedral, the Seagrams Building in New York, and the music of Bach and Frank that are played on those organs. At the dawn of the 21st Century, worldwide, there are probably over one hundred artistic and dedicated organ builders who can produce instrument of this high quality, organs that would delight both Bach and Frank, as well as restore and repair organs. Isn’t the difference only a matter of degree, and not principle, between replacing or substituting an electronic instrument for such a real work of art, a pipe organ, and substituting a photograph for a real painting, or even providing recorded performances? Why have live concerts? Fifteen out of the twenty the halls in the excellent category have pipe organs, with the five exceptions including three having stage houses and uses requiring scenery. Carnegie Hall did achieve a reputation for excellence during the period when it did, indeed, have a pipe organ.
Organs in Multipurpose Halls
Figure 31 indicates that even such multipurpose halls can have pipe organs if enough thought and planning is achieved. At Milwaukee’s Uhlein Hall, the organ is located on an elevator whose roof part of the stage floor when the organ is not used, but then rises to locate the organ on stage when its use is required.
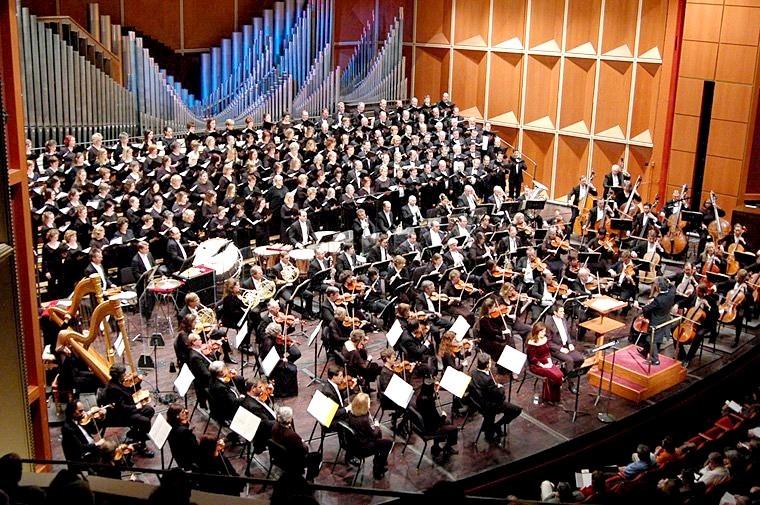
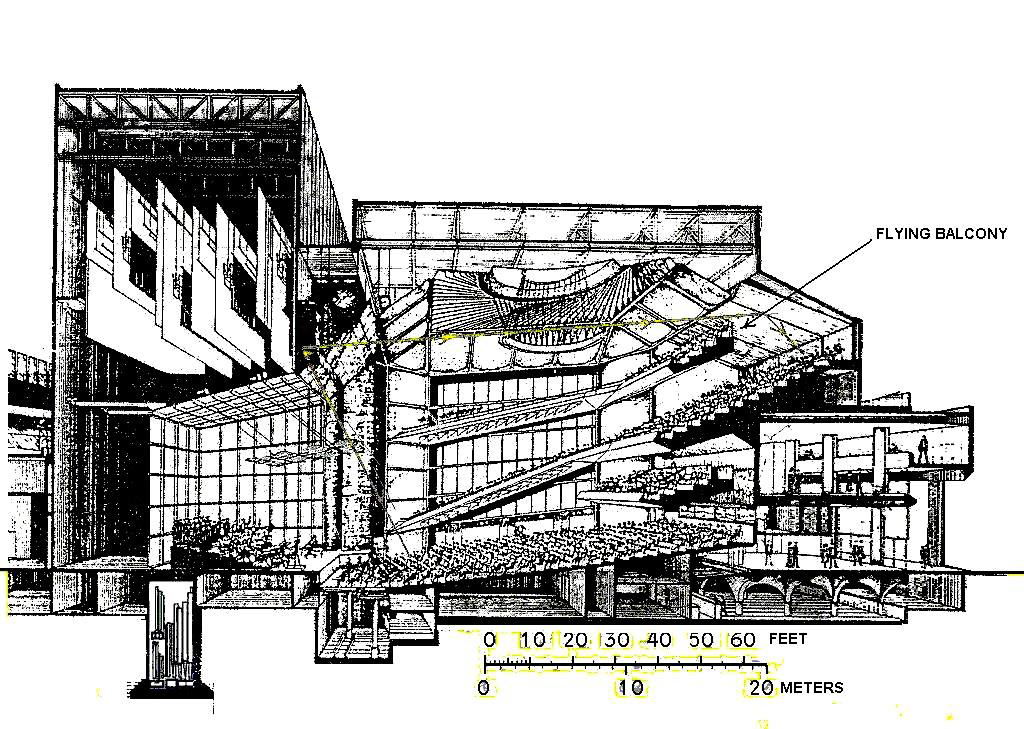
Figure 31. The organ at Uhlein Hall, Milwaukee, shown in-use above, and lowered with its elevator for storage below stage when not in use. Harry Weise and Associates, architects, Bolt Beranek and Newman, acoustics. Section drawing, George Izenour, theater consultant, photo, Milwaukee Orchestra.
Other possibilities include organs on platforms with wheels or air-casters and backstage walls that rotate 180 degrees with the organ attached to one side.
Dr. Harris softened his stand on pipe organs shortly before his death, and consulted with Calvin Hampton, composer and organist and choir director at Calvary Episcopal Church, on a possible design for an organ for Avery Fisher Hall. The idea was to maximize the resources of the organ, particularly those most useful in for the organ and orchestra repertory, while minimizing its sound absorption. No action was taken at Avery Fisher, but Benaroya Hall in Seattle, a successful hall and the last hall for which Cyril was consultant, has a fine C. B. Fisk pipe organ. Although the hall is included in Dr. Beranek’s 2003 book, it was not included in his interviews for concert hall excellence.
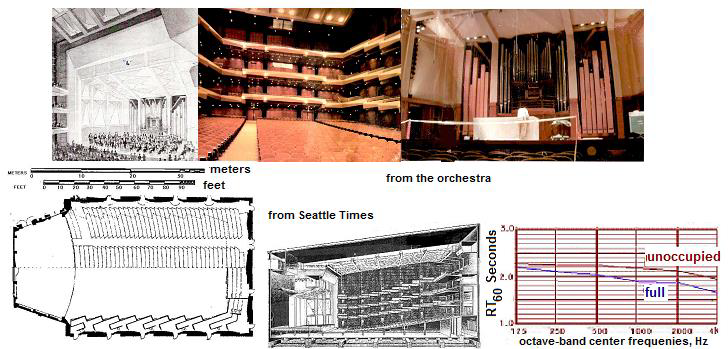
Figure 32. Seattle’s Benaroya Hall. LMN architects, Cyril Harris, acoustics. C. B. Fisk organ. Journal of the Acoustical Society of America, 106:6 “Acoustics of Beneroya Concert Hall,” Dec. 2001, p. 2841-44
XII. Using this Paper
This paper is meant to be used with the Beranek 1996 and 2003 books, not to replace them. The useful information in these books is far greater than the points discussed in this paper. At the same time, use of this paper should permit the concert hall designer a greater degree of freedom than that suggested in Dr. Beranek’s books. Yes, non-shoebox concert halls can be excellent; both Clarity and Reverberation Time are important; overhead panel arrays, originally used to control echo and focusing effects, and to provide even sound distribution, can also provide the right balance between liveliness (the perception of reverberation) and clarity/music intelligibility; and pipe organs should be considered as essential for all important concert halls. But additional data can help to substantiate these hypothesizes. I hope data will be obtained to fill the gaps in the table, and to include such important halls as New York’s Allice Tully, Town, and YMHA Halls, the Troy, NY and the Detroit Orchestra Halls, the St. Louis Powell Hall, and many others.
Finally, intruding air-conditioning noise. noise from other mechanical equip-ment, traffic noise, aircraft noise, vibration from nearby subways or truck traffic, etc., can spoil any classical music concert. Issues of noise and vibration control and sound isolation are not discussed in this paper but are very important. The three Beranek books do not deal with these problems in detail. Reference 6 Marshall Long) is highly recommended for these issues. Reference 8 (E. David Egan) is also useful, but I have not seen the latest edition, and the reference is for the First Edition. Sound isolation consideration for music performance, rehearsal, practice, and teaching facilities are discussed comprehensively in Reference 44. Reference 3 (John Eargle and Chris Foreman) can provided guidance for concert hall sound systems, along with the two Sound Reinforcement Anthologies of the Audio Engineering Society, as 26, 28, 32, 33, 37, 38.
Acknowledgments
I thank David Conant, Ken Dickensheets Chris Foreman, Memdel Kleiner and Marshall Long for valuable and timely suggestions and proofreading, and the students and teachers at my Yeshiva for their immense tolerance.
References and Notes
1Two website www.proaudioencyclopedia.com articles: “The Early-To-Reverberant Sound-Energy Ratio In Concert Hall Acoustics” and “An Autobiographical Assessment of the Importance of the Early-to-Reverberant Sound-Energy Ratio, “Clarity,” in Speech Acoustics.“ Some points in this article are discussed in more detail in these two articles.
2L. G. Marshall, “An acoustics measurement program for evaluating auditoriums based on the Early/Late Sound Energy Ratio,” J. Acoust. Soc. Amer., 96, 2251-2261, 1994; “An analysis procedure for room acoustics and sound amplification systems based on the Early/Late Sound Energy Ratio,” Journal of the Audio Engineering Society, 44, 373-381 (1995), reprinted in Sound Reinforcement, 2, Audio Engineering Society, New York, 1996′ pp. 380-388: M. Kleiner, D. L. Klepper, and R. Torres, Worship Space Acoustics, J. Ross, Fort Lauderdale, 2010, p. 62.
3J. Eargle and C. Foreman, Audio Engineering for Sound Reinforcement, Hal Leonard and JBL Pro Audio Publications, 2002, Milwaukee, p. 218
4W, Reichardt,, A. Alim, and W. Schmidt, “Zusammenhang zwischen Klarheitsmass, C, und anderen objektiven raumakustischen Kriterien,” (Correspondence between the metric Clarity C and other objective criteria for room acoustics) Z. elektr. Inform, u. Energietchnik, Leipzig, 5, 144-155 (1975)
5A. C. Gade and J. H. Rindel, Akustik I Danske Koncertsaale, (Acoustics in Danish Concert Halls) Publikation Nr. 22l, Laboratoriet for Akustik, Danmarks Tekniske Hoejskole, Lyngby, 1984.
6M. Long, Architectural Acoustics, Academic Press. New York, 2006, p. 671-674. Second Edition, 2013, p. 748-752. The definition of the term clarity factor as C80 is given on page 673 in the First Edition and p. 751 in the Second Edition. Speech intelligibility is addressed p. 590-604, First Edition and p. 648-663 in the Second Edition
7J. S. Bradley, “A comparison of three classical concert halls,: J. Acoust. Soc. Amer. 89, 1176-1192 (1991).
8M. D. Egan, Architectural Acoustics, McGraw-Hill. New York, NY 1988, p. 98.
9A. Kuusinen, J. Patynen, S. Tervo, and T. Lokki, “Relationships between preference ratings, sensory profiles, and acoustical measurements in concert halls.,” J. Acoust. Soc. Amer., 135-1, 239-250, (2014).
10D. Malon and E. Wood, Sound Ideas, Acentech, Cambridge, MA, 2005; work in aviation is in Chapter 2.
11R. David Read,“Biography of Leo L. Beranek” Sound & Communications, June 2004, and on the website www.proaudioencyclopedia.com; also, honors and awards:
Fellow of the American Academy of Arts and Sciences (1952)
Wallace Clement Sabine Medal of the Acoustical Society of America (1961) for internationally recognized achievements in all phases of architectural acoustics, and his publications on acoustical measurements, and the world’s great concert halls.
Gold Medal of the Audio Engineering Society (1971)
Gold Medal from the Acoustical Society of America (1975) for leadership in developing, in the United States and abroad, the desire and the capability for achieving good acoustics in communications, workplaces, concert halls, and communities.
National Medal of Science in Engineering (2002)
IEEE Founders Medal (2013)
Rayleigh Medal of the Institute of Acoustics, United Kingdom (2014).
12L. L. Beranek, “Acoustics of the Frederick R. Mann Auditorium, Tel Aviv, Israel,” J. Acoust. Soc. Amer., 31, 882-895 (1959)
13L. L. Beranek, Audience and chair absorption in large halls”, J. Acoust. Soc. Amer., 45:1, 13-19 (1969)
14L. L. Beranek and T, Hidaka, “Sound absorption in concert halls by seats, occupied and unoccupied,, and by the hall’s interior surfaces”, J. Acoust. Soc. Amer., 104, 3169-3177 (1998
15L. L. Beranek, Concert Halls and Opera Houses, Music Acoustics and Architecture, Academic Press., Springer-Verlag. New York, 2002. p.501-502 for audience sound-absorption, Note that all acoustical terms and abbreviations used by this author are well-defined in this book, which has an excellent index and a comprehensive reference list. Available from the Acoustical Society of America. Note on pages 50 and 626, Symphony Hall, Boston, volume is 18750m3, not 8750m3. Page 499. The first sentence of paragraph under “Shape” is self-contradictory. Tanglewood’s Shed’s success proves an excellent fan-shaped hall is possible. Also there have been other excellent modern first-class halls, including the Pasadena Ambassador College Auditorium and the Northbridge Valley Performing Arts Center, both California, and Whelin Hall, Hamilton University, Clinton, NY. Page 500, The first sentence of the second paragraph is wrong. The Teatro Colon, Beunos Aries, Argentina, is excellent and horseshoe-opera-house-shaped, and the Berlin Hall, a surround hall, comes after it in the excellent class. Page 527. The last sentence of the second paragraph should be interpreted to mean a lack of early reflections rather than a long reverberation time per-se. This agrees with Beranek’s view of the Dallas hall, pages 75 and 79. The last sentence, third paragraph, page 527, wrong and should be omitted. Figure 4.2, page 529, shows that Early Decay Time is closely correlated with Reverberation Time, 0.99, whereas Clarity not at only 0-.84. Page 529, Table 4.2, the 0.88 correlation between Early Decay Time and Clarity, 0.88, should be shown boldface or the 0.84 above without boldface. Page 538, the last sentence of the second paragraph is wrong and should be removed. Again Clarity can be shown to be reasonably independent. In perspective, compared to the some 15,000 data points, suggestions, and details included in the last of the three books, these corrections are very few in number.
16L. L. Beranek, Concert and Opera Halls, How They Sound, Acoustical Society of America, Woodbury New York, 1996. There are halls not included in the previous or following books. Some of my few corrections noted for the above reference are not required for this book.
17L. L. Beranek, Music Acoustics, and Architecture, Acoustical Society of America, New York, 1962, Chapter 6, p. 43 – 610. Halls discussed in this book but not in the two later Beranek concert hall books, include Bristol, England, Coston Hall; Cambridge, Massachusetts, M. I. T., Kresge Auditorium; and the N. Y. Metropolitan Museum’s Grace Rainey Rogers Auditorium.
18W. R. Farrell, “Masking Noise Systems in Open and Closed Spaces,” JAES, (March, 1975), reprinted in Sound Reinforcement, AES Anthology, New York, 1978 p. E62-66.
19W. J. Cavanaugh, W. R. Farrell, P. W. Hirtle, and B. G. Watters, “Speech Privacy in Buildings,” J. Acoust. Soc. Amer., 34, 475-6 (1962).
20V. O. Knudsen and C. Harris, Acoustic Designing in Architecture, John Wiley and Sons, New York.NY, 1950.
21P. H. Parkin and J. H. Taylor, ”Speech reinforcement in St. Paul,s Cathedral,,, Wireless World 58:2, 58-61 and 58:3, 109-101 (1952), and reprinted in the J. Audio Engineering Society, 54, p. 67-74, 2006.
22L. L. Beranek, “Sound Systems for Large Auditoriums,” J. Acoust. Soc. Amer., 26, 661-675, 1954.
23D. L. Klepper, “The Distributed Column Sound System at Holy Cross Cathedral, Boston, the Reconciliation of Speech and Music”, J. Acoust. Soc. Amer., 99:1, 417-425, 1996. The excellent 1875 Hook & Hastings organ in this Cathedral is discussed in B. Owen, The Organ in New England, The Sunbury, 1979, p.324-326, 600, 607, available from the Organ Historical Society, Richmond, VA,. But the organ is no longer neglected! (CDs are available.)
24D. L. Klepper, “First Presbyterian Church, Stamford, Connecticut,” J. Acoust. Soc. Am. 31, p. 879–882, 1959. Years of hindsight suggests the words “early sound energy” should have been used instead of “direct sound” throughout this paper.
25D. L. Klepper, “Tent shaped concert halls, existing and future,” J. Acoust. Soc. Am. 124, p. 15–18, 2008.
26C. R. Boner, “Some Examples of Sound-System Correction of Acoustically Difficult Rooms, JAES, April, 1967, reprinted in Sound Reinforcement, AES Anthology, New York, 1978 p. B10-12. The first system discussed is an example. The others are distributed loudspeaker systems, but these are also designed to raise C50.
27V. M. A. Peutz and W. Klein, “Articulation loss of consonants in the presence of noise, reverberation, and echo” (trans. from Dutch), Acoust. Soc. of Netherlands 28, 1974.
28V. M. A, Peutz, “Articulation Loss of Consonants as a Criterion for Speech Transmission in a Room,” J. Audio Engineering Society, Dec. 1971, also Sound Reinforcement, AES. Anthology, New York, 1978, p.A23-27; W. Klein “Articulation Loss of Consonants as a Basis for the Design and Judgment of Sound Reinforcement Systems,” J. Audio Engineering Society, Dec. 1971, also Sound Reinforcement, AES Anthology, New York. 1978, p. A28-30 plus correction on p. A31.
29D. Davis and C. Davis, “The Application of Intelligibility to Sound Reinforcement,” J. Audio Engineering Society, 39, p. 1002-1019, (Dec. 1989), and Sound Reinforcement, AES Anthology 2, New York. 1996, p. 438-454.
30C. Curtis and C. R, Emerson, “Those Early Late Arrivals, Mr. Haas, What Would You Do?” J. Audio Engineering Society, 28, p. 40-45, (Jan.-Feb. 1980), and Sound Reinforcement, AES Anthology 2, New York. 1996, p. 400-409.
31J. P. A. Lochner and J. F. Burger, “The Influence of Reflections on Auditorium Acoustics,” Journal of Sound and Vibration, 1, p. 426- 1964. Some may still only consider reverberation time: D. Allcott, “Faith comes from Hearing,” Sound and Communications, Jan. 2012: The acoustics were judged in an all-hard empty church, and sound absorption was installed, possibly in greater quantity than the very best sound system would have required. Compare with A. Vargass, “With the Right Tools,” Sound and Communications., April 2015, p.22, 24-25, 102-103. Here an unusual sound system to meet existing room conditions was installed, and a conflict with the church musicians was avoided.
32J. J. Figwer, “A New Method for Evaluating the Effectiveness of Sound Amplification Systems in Reverberant Spaces”, J. Audio Engineering Society, 16, Oct. 1968`p. 416-418, reprinted in Sound Reinforcement, AES Anthology, New York, NY, 1978, p. A-13-15.
33R. C. Heyser, “The Determination of Loudspeaker Signal Arrival Times,” JAES 19, Part 1, p. 734-743, Oct. 1971, Part 2, p. 829-834, Nov., Part 3, p. 902-905, Dec.; also Sound Reinforcement, AES Anthology 2, New York. 1996, p. 82-114.
34P. Mapp, “Measuring Intelligibility,” Sound & Communications, April 2002, p. 56-68. Note also his discussion of specific equipment problems, S&C, April 2015, p. 12, 14. I suggest reading all Peter Mapp’s S&C monthly columns.
35D.L Klepper, “Sound Systems in Reverberant Rooms for Worship,” Journal of the Audio Engineering Society, Aug. 1970, also in Sound Reinforcement, AES Anthology, New York, 1978, p. E-46-E56
36D. L. Klepper, The Acoustics of St. Thomas Church Fifth Avenue.”, JAES 43:7/8, p. 99-101, 1995, also Sound Reinforcement 2, AES Anthology, New York, 1996, p. 392-394; D. Clayton and C. Whitney, 147th ASA Meeting, 75th Anniversary, Organ Recital (program). Acoust. Soc. of Am, Melville, NY, 2004
37H. Haas, “Uber den Einfluss eines Einfachechos auf die Horsamkeit`von Sprache,” Acoustica 1, I1951) p. 49-58. English translation by K. P. R. Ehrenberg as “The influence of a Single Echo on the Audibility of Speech,” Building Research Station Library Communication 363, Dec. 1949, Watford, Harts, England, reprinted in JAES, 20, March 1972, and in Sound Reinforcement, AES Anthology, 1978, Audio Eng. Soc, N.Y., p. C-20; R. H. Bolt and P. E. Doak, “A Tentative Criterion for the Short-term Transient Response of Auditoria” J. Acoust. Soc. Amer., 22, p. 507-508, 1950
38L. L. Beranek, F. R. Johnson, T. Schultz, and B. Watters, “Acoustics of Philharmonic Hall during its First Season,” J. Acoust. Soc. Am., 36 No. 7, p. 1247-1262, July, 1964
39T. Schultz and B. Watters, “Propagation of sound across audience seating,” J. Acoust. Soc. Am., 36 No. 5, p. 885-896, May, 1964; G. Sessler and J. West “Sound transmission across theatre seats,” J. Acoust. Soc. Am., 36, No.9, p. 1725-1732, Sep. 1964.
40Paul S. Veneklasen and Jerry P. Christoff, Seattle Opera House – Acoustical Design, The J. Acoust. Soc. Am. 36, p. 903, 1964. Note that this may be the first paper dealing with music acoustics spaces where the possibility of both clarity and reverberation is discussed in a hall where the concept is realized. However, missing completely is a discussion of the balance between the two effects. The impression is that while two seconds is the ideal reverberation time for symphonic music, clarity can be unlimited. The right balance in this hall was thus a matter of luck, the balance confirmed when I heard a symphony concert there with the acoustics approximating those of Jerusalem’s Binyanae HaOomah and typical Carnegie Hall seats for me at the time. Possibly the reverse may be proved, that reverberation time may be unlimited, but the correct balance with clarity is important, C80 of -1.0 to 1.0 in the occupied hall. The success of the Dallas Myerson Center concert hall, with 2.8 seconds RT and C80 of -0.7 occupied is a step in that direction.
41Reference 15, page 506, then 616. D. F. V. Keet, “The influence of early reflections on spacial impression,” 6th International Conference on Acoustics, Tokyo, 1968. T. Okana, L, L. Beranek,T. Hidaka, “Relations among internal cross-correlation coefficient, IACCE, lateral fraction, LFE, and apparent source width, ASW, in concert halls, Jour. Acoust. Soc, of Am. 104, p. 2398-2411, 1998; M. R. Schroeder, “Binaural dissimilarity and optimum ceilings for for concert halls: more lateral diffusion,” J. Acoust. Soc. Am., 22, p. 958-963, 1963. These references will lead to others. The lateral fraction measurements are usually conducted both in the 0 – 80 millisecond and the post-80 millisecond time-frames. While it is the latter that provides enveloping reverberation, it is the earlier that both broadens source width and impresses the listener with closeness to the orchestra. If the design of the hall is satisfactory for the early sound arrival directions at the listener, it is almost impossible to design the hall that will at the same time not be satisfactory for the late arriving sound energy. Thus Beranek chose BQI, which is based on the 0-80 millisecond energy, and which also has the advantage of minimum difference between full and empty occupancy.
42A. Abdou and R. W. Guy, “Spatial information of sound fields for room-acoustics evaluation and diagnoses”, J. Acoust. Soc. Am., 100:5, p. 3224-3225, Nov. 1996.
43M. Kleiner, D. L. Klepper, and R. Torres, Worship Space Acoustics, J. Ross, Fort Lauderdale, 2010, p. 114-116, 247-254.
44W. J. Cavanaugh, D. L. Klepper, and L. G. Marshall, “Noise Control for Music Buildings”, Noise Control Engineering, 15, p. 71-19, Sep.-Oct. 1980
45Yoichi Ando, Auditory and Visual Sensations, Springer, New York NY (2009) I have not referred to this book in the above text, but it is the only source of research results, in book form, that suggests why musicians and educated listeners have specific preferences for reverberation. Clarity, and other effects of the acoustical environment.
About the Author
David Lloyd Klepper is currently a student of Rabbinics at Yeshivat Beit Orot, Jerusalem, Israel, having moved to Israel in 1996 from his position as President of Klepper Marshall King, White Plains, NY, Acoustical Consultants, and as Adjunct Professor of Architectural Acoustics at City University, New York City. Before 1971 he was a senior consultant at Bolt Beranek and Newman, starting his consulting career there in May 1957. He received his SM and SB degrees in Electrical Engineering from MIT, and between times served as Assistant Audio-Radio Member of the PsyWar Board at Fort Bragg, NC, during the Korean conflict, leaving active duty as a 1st Lt. He provided acoustical advice for over 200 worship space buildings, including the National Presbyterian Church, Washington, DC, St. Thomas Church Fifth Avenue, New York City, the Capetown, South Africa, Anglican Cathedral, River Road Baptist Church, Richmond, Virginia, Young Israel of Southfield, Michigan, and Boston’s Holy Cross Cathedral. In this capacity, he was a pioneer in application of digital delay and electronic simulation of reverberation in worship spaces, and pew-back speech reinforcement. Publications include 40 papers in professional journals, a coauthor with Professor Kleiner and Father Rendell Torris of the book Worship Space Acoustics, JRosspub.com., and Editor of the two Sound Reinforcement Anthologies of the Audio Engineering Society. He is a fellow of both the Acoustical Society of America and the Audio Engineering Society, past Emeritus Board Certified member of the Institute of Noise Control Engineering, and a member of both the American Guild of Organists and the Organ Historical Society. He also belongs to a number of railroad and public transit interest organizations. You may contact Klepper at ddaveklepper1@gmail.com.
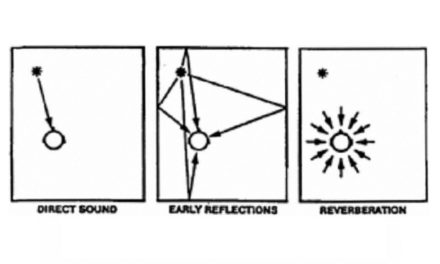
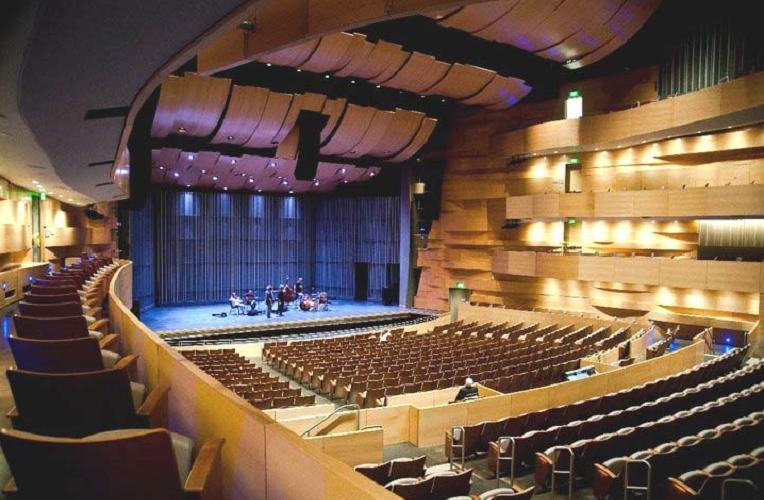
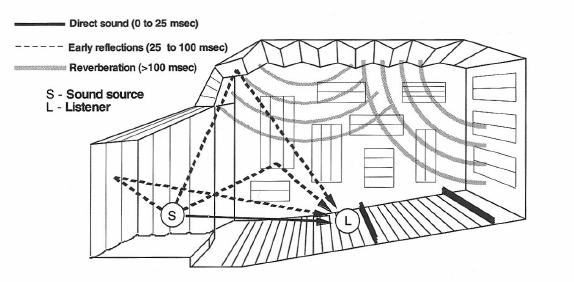